

What Would It Take To Crash Home Prices?
The crash everyone keeps predicting requires conditions we don't have


The housing crash narrative has remarkable staying power. For three years running, prominent analysts have predicted double-digit price declines, arguing that affordability has become so stretched that the market must break. The bubble-watchers point to mortgage payments at multi-decade highs relative to income, collapsing first-time buyer participation and median households locked out of median homes in most major metros. The affordability numbers are genuinely ugly. The case for a correction sounds increasingly plausible.
In a previous article, I argued the housing market feels broken but isn’t breaking — because the mechanisms that would crash prices aren’t present.
So the obvious question deserves a serious answer: what would it take to crash home prices?
Start with the mechanics. There are only two ways to get a real housing correction on a national basis:
1. You get a material supply glut.
2. The consumer gets genuinely wrecked.
That's it. Supply glut or consumer destruction. Every crash in the historical record traces back to one or both of these conditions. In 2008, we got both simultaneously.
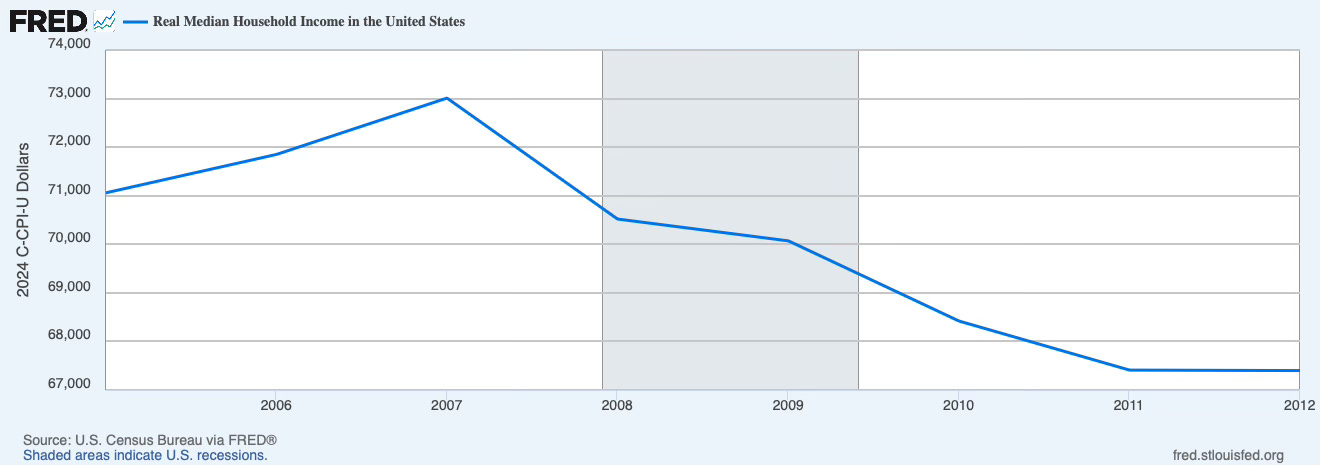
Real incomes dropped for four straight years.
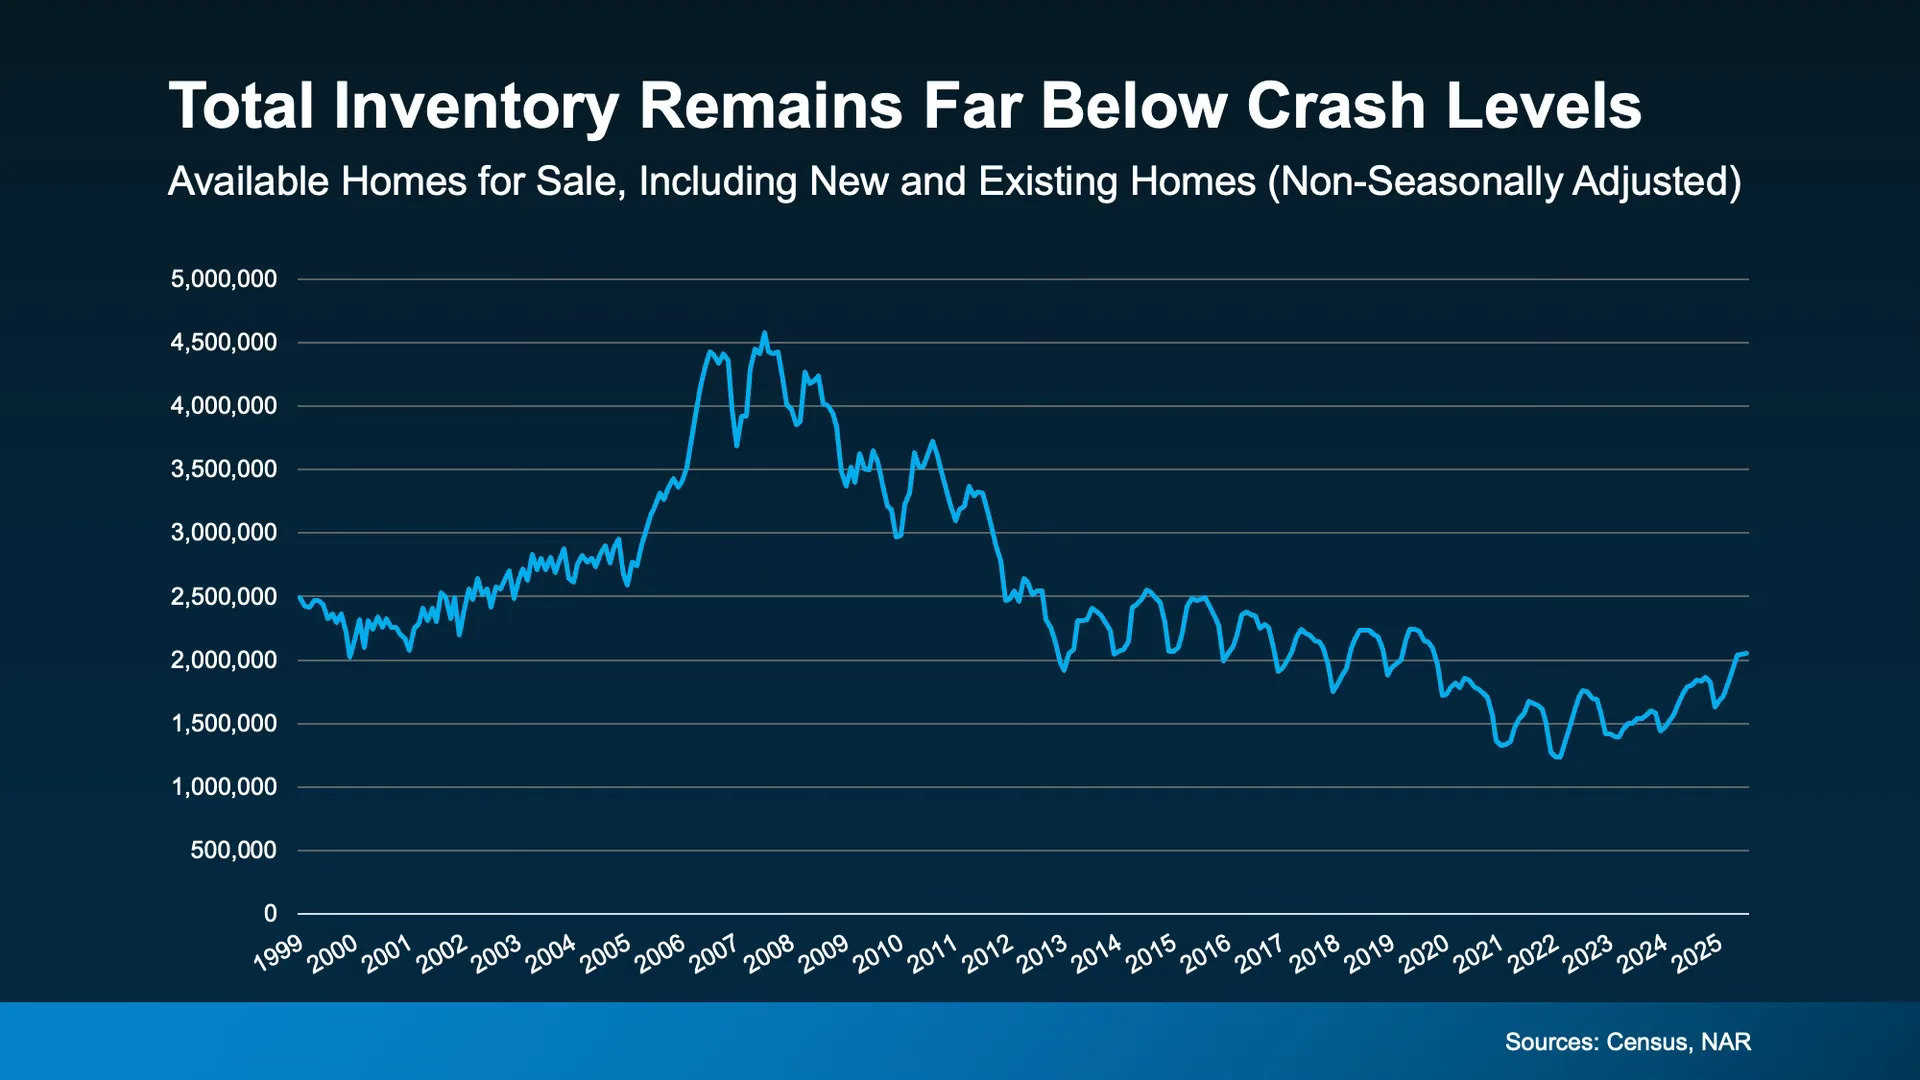
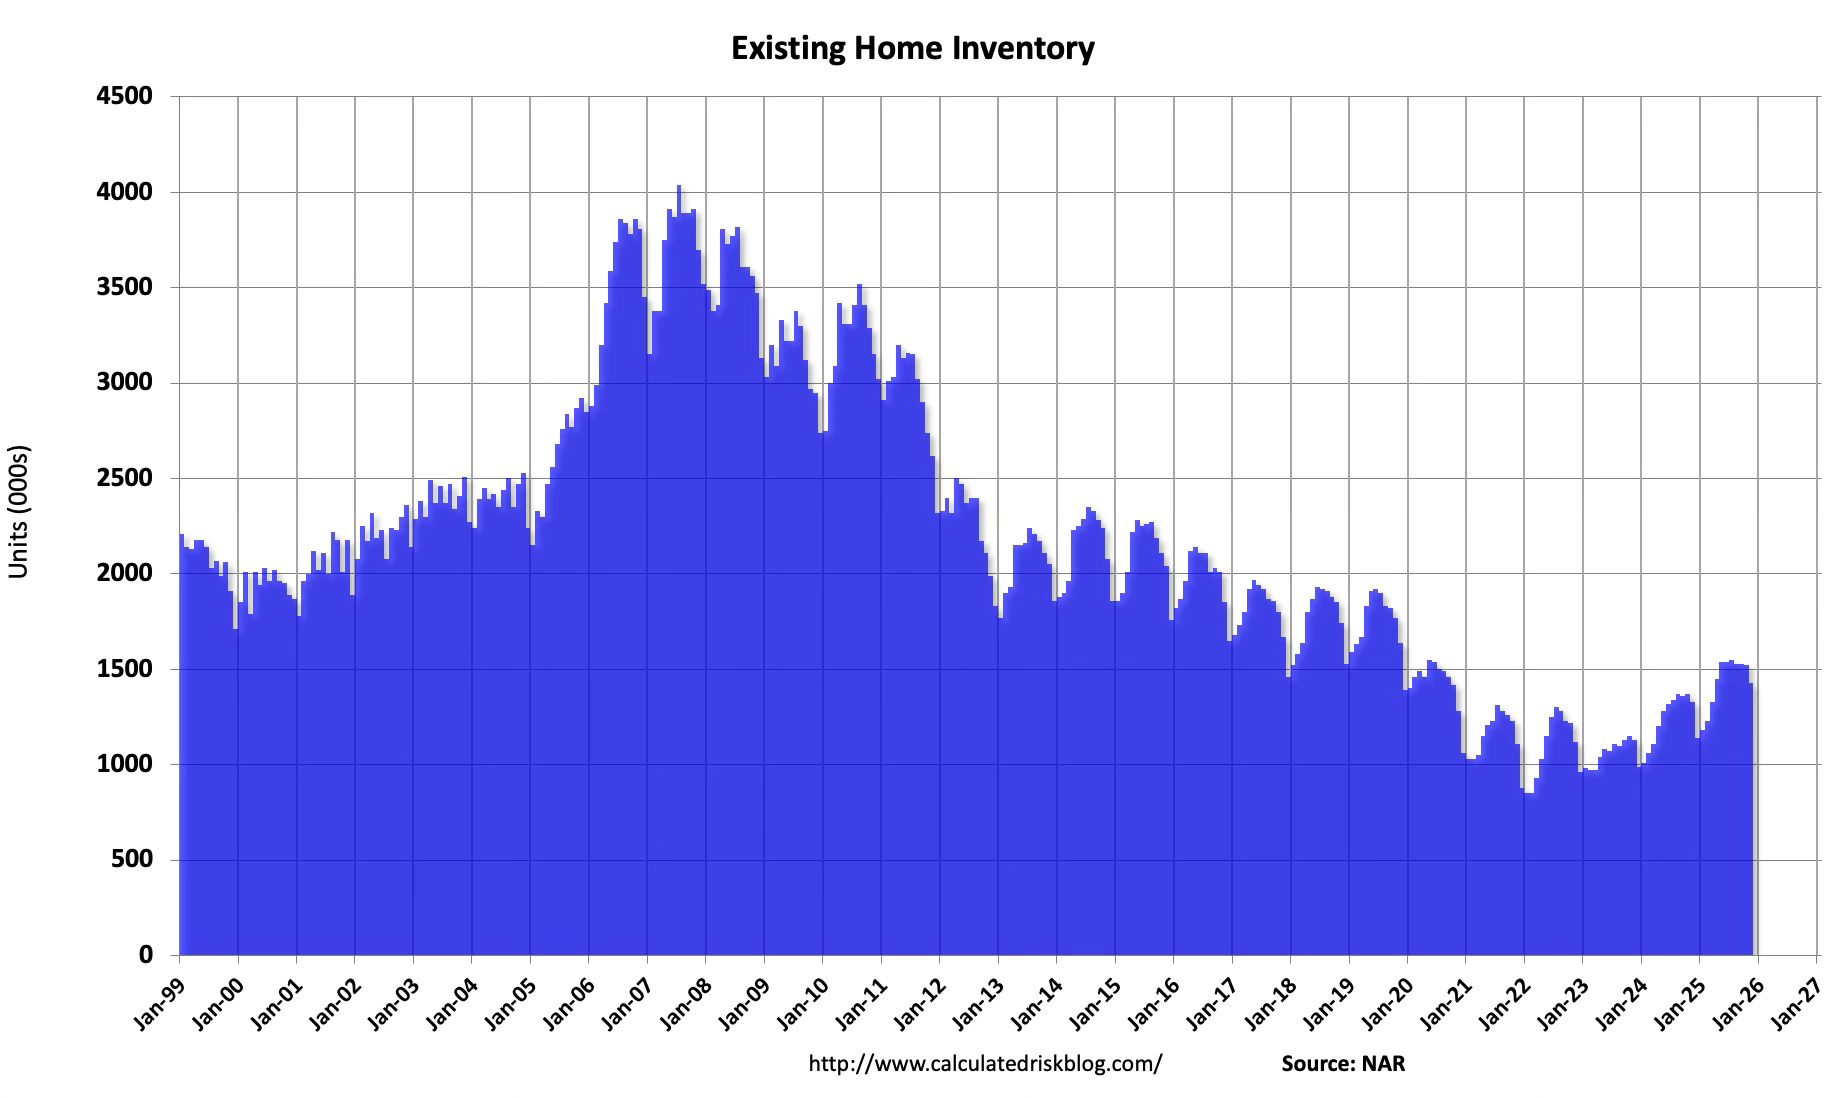
And inventory skyrocketed and stayed high for years.
Neither is present today — at least not yet. But there are credible paths to each. Let's stress-test them.
The Supply Thesis
A wave of new construction that overwhelms demand. That’s the first path to a correction — and the argument housing bears keep circling back to.
It’s not happening.
And understanding why it’s not happening tells you something important about the structural floor under prices.
The national builders operate on a simple discipline. They monitor completed unsold inventory like a hawk. When completed homes for sale approach 120,000 units nationally, they pull back starts. When months of supply crosses above 6.5 months, they slow permits. This isn't ideology — it's margin management. Overbuilding destroys gross margins and the publicly traded builders answer to shareholders who care about profitability, not market share.
This discipline is post-GFC scar tissue, and it’s real. Before 2008, builders were running completions at 2.2 million units annually, fueled by exotic mortgage products that manufactured demand. When that demand evaporated, they were left holding inventory they couldn’t move. The industry consolidated. The survivors learned the lesson permanently: you build to orders, you protect margins and you never let completed inventory run.
Today, housing starts and permits are running well below replacement demand — even as the shortage narrative persists. The builders aren’t ignoring demand. They’re rationing it. Small local builders can still get overextended in specific markets (Austin, parts of Florida), but the nationals that deliver the majority of new product are far too disciplined to flood the market. Their risk aversion is actually one of the reasons the housing shortage persists.
The doomers point out — correctly — that active listings are recovering. January 2026 reached the highest active inventory level for the month since 2019. That’s real progress toward normalization.
But context matters. New listings data — the key early indicator of seller stress — is running at roughly 55,000–65,000 per week in early 2026. That’s normal for January. During the seasonal peak, 80,000–100,000 per week is typical. Distressed selling would look like 200,000 to 300,000 new listings per week. That’s a four-fold gap between where we are and what actual distress looks like — a vertical breakout that hasn’t come close to materializing. And since June, the rate of inventory growth has actually been slowing.
It would take a severe job-loss recession to generate the income destruction and foreclosures needed to push listings into distress range. Even then, the process is slow — foreclosures take 9–18 months in judicial states. If that wave were building, you'd already see it in the data. You don't.
The Silver Tsunami That Isn’t
One supply thesis keeps circulating: the “silver tsunami.” The idea is that Baby Boomers will die or downsize en masse, flooding the market with inventory and crashing prices. For years, analysts have held out hope that demographic inevitability would do what policy couldn’t — unlock supply at scale.
The data says otherwise. The tsunami is arriving as a soft, rolling wave — and most of it never reaches the open market.
Cotality reports that a record 340,000 U.S. homes were transferred through inheritance in the 12 months ending August 2025 — 7% of all property transfers, the highest share ever recorded. That sounds like fresh inventory. It’s not. A property transfer just means the title moved. It doesn’t mean the home was listed. Most of these properties are being kept by heirs — as primary residences, as rentals, or as family assets that never see the open market.
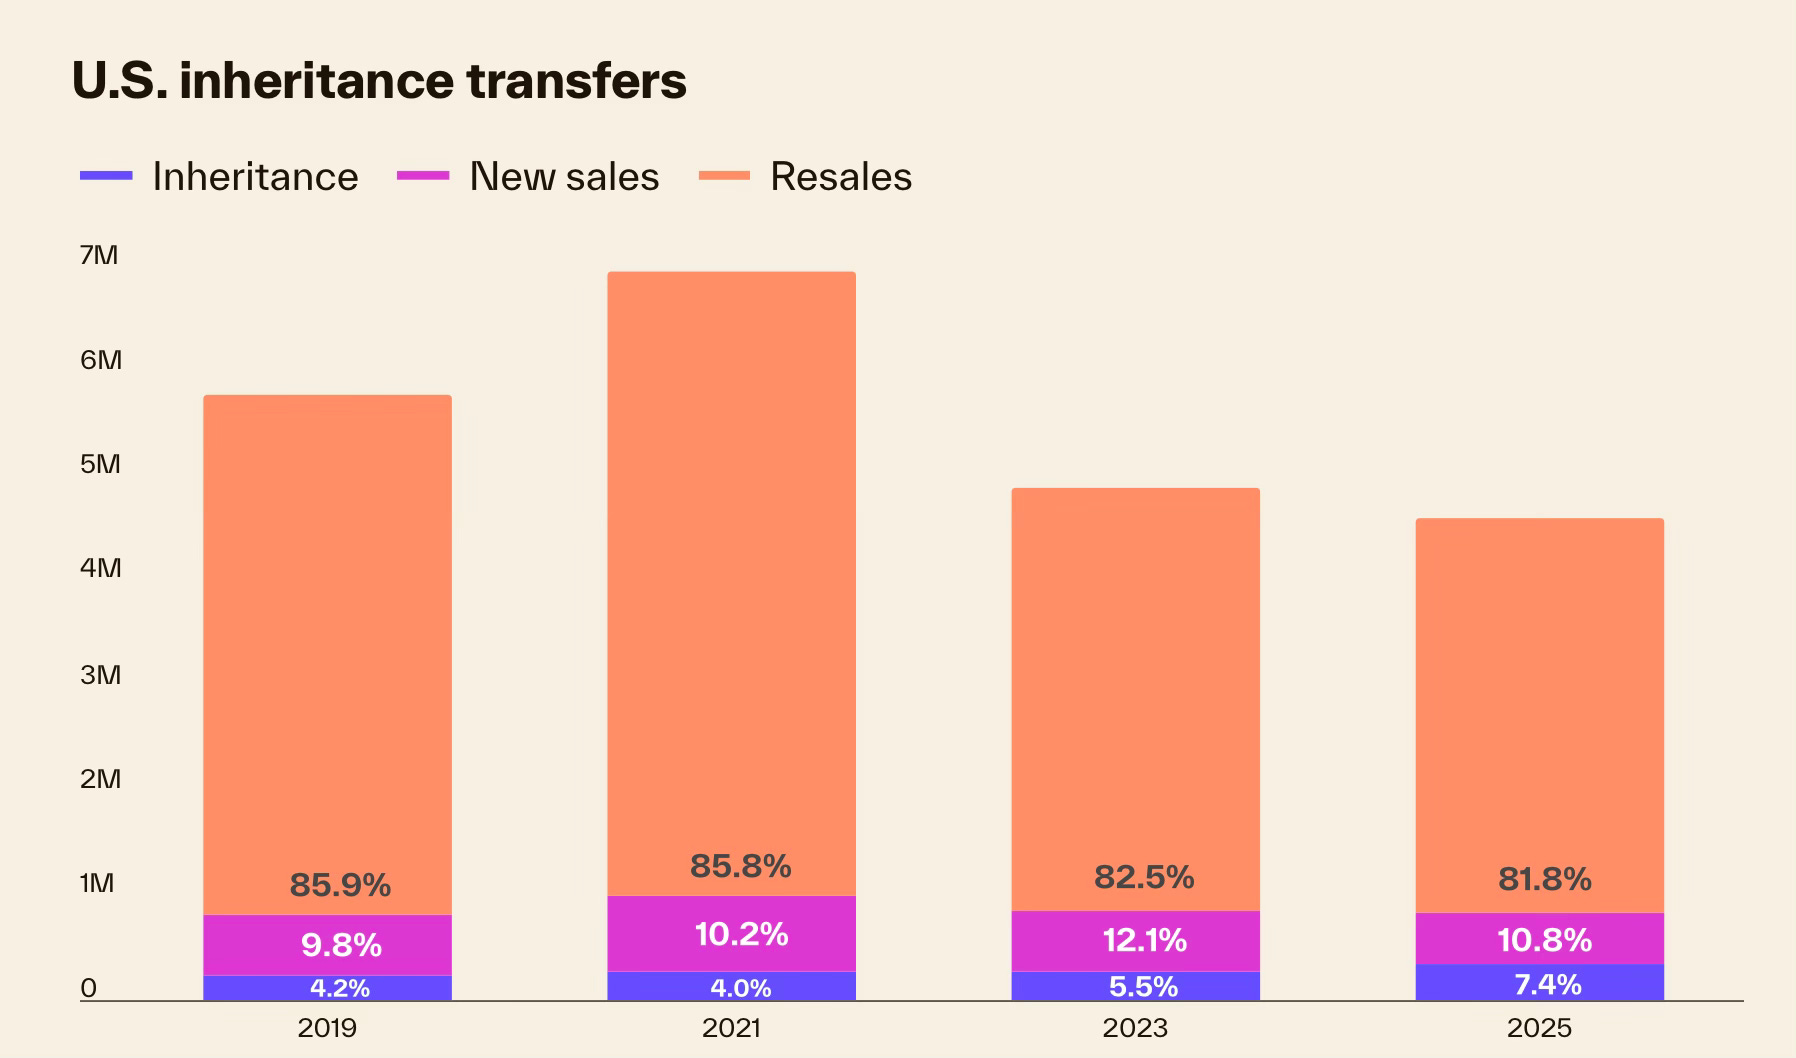
Source: Cotality
The challenge starts with the Boomers themselves. They just aren’t leaving. Americans born in 1948 owned roughly 50% more homes at age 65 than those born just a decade earlier — the largest senior cohort in history sitting on the largest housing stockpile in history. And they’re staying put longer than any previous generation. Only 17% of homeowners born in 1946 moved between ages 65 and 75, down from 22% of those born in 1938. AARP surveys show 75% of older homeowners plan to age in place. When they do eventually pass, tax policy in states like California creates powerful incentives for heirs to keep rather than sell, effectively removing potential supply from the broader market.
Here’s the number that puts the tsunami to rest. Freddie Mac projects 9.2 million fewer boomer homeowner households by 2035 — down from 32 million in 2022 to roughly 23 million. That sounds like a flood of supply. But spread it over a decade and it’s approximately 250,000 net units per year. Meanwhile, the Urban Institute projects 8.5 million new households forming this decade alone. New demand absorbs the boomer release before it can accumulate into a glut.
And the geographic mismatch seals it. Zillow’s analysis shows empty-nest households are concentrated in affordable metros — Pittsburgh, Buffalo, Cleveland, Detroit — not in the expensive coastal job centers where supply is actually scarce. The silver tsunami, to the extent it arrives, delivers inventory where it’s least needed.
The Boomers aren’t selling. And when they die, their kids aren’t selling either.
Regional Corrections ≠ National Crash
But wait — aren’t prices already falling in some markets?
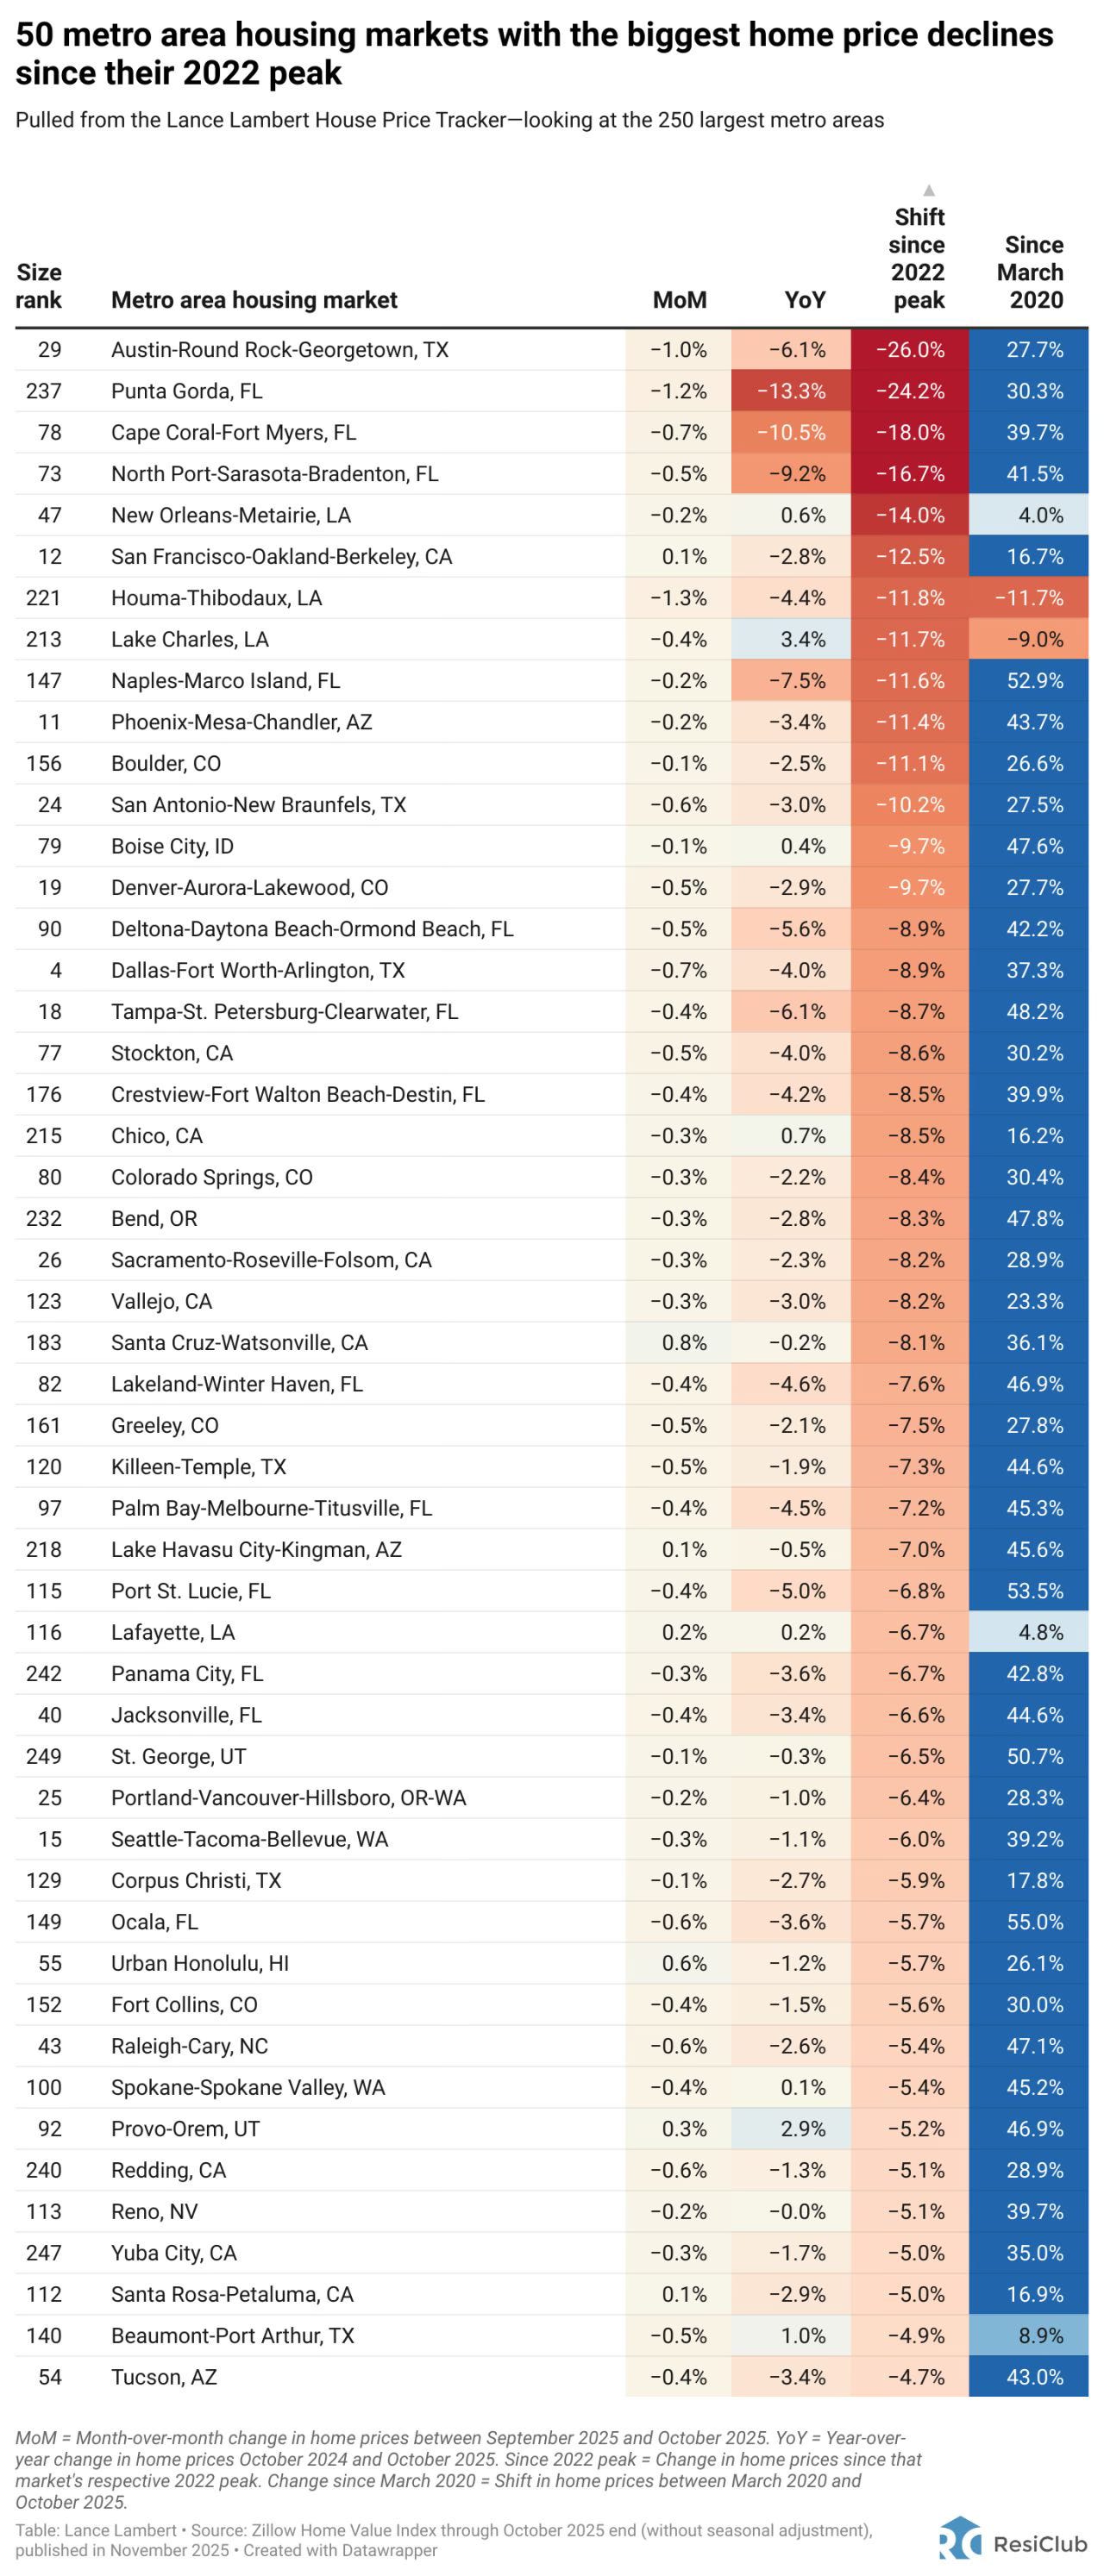
Yes. And this is where the bear case gets more nuanced. The argument isn’t that every market will crash simultaneously. It’s that regional corrections in Florida, Texas and the DC metro are the front edge of something larger — that the problems are starting in those markets and will spread from there.
The data is real. Six of the top ten metros with declining prices are in Florida. DC-area inventory is up 50% with prices down three years running. Austin, Phoenix and parts of the Mountain West have given back a meaningful chunk of their pandemic-era gains.
But the question isn’t whether individual markets can decline. They obviously can and are. The question is whether there’s a mechanism to make those declines contagious — to transmit regional pain into a national crash.
In 2008, that mechanism existed. When subprime borrowers defaulted in Phoenix, the losses hit nationally diversified MBS portfolios, which tightened credit everywhere, which created more defaults, which crashed prices nationally. That contagion had a financial transmission vector.
That chain doesn’t exist in anything like its 2008 form. The mortgage market has been fundamentally restructured. Over 70% of outstanding mortgages are now agency-backed (Fannie, Freddie, Ginnie) — meaning the credit risk sits with the government, not with private bank balance sheets. The private-label securitization market that amplified losses in 2008 has never recovered to anything close to pre-crisis scale. Banks aren’t holding concentrated portfolios of subprime MBS. Underwriting standards are materially tighter — median FICO scores for new originations have been running above 730 for years. And critically, most of these loans are 30-year fixed rate, which means there’s no payment-reset trigger sitting in the system.
Could a severe recession cause losses in the agency MBS market? Sure. But as it stands today those losses would be absorbed by the GSEs and ultimately the Treasury — not transmitted through bank balance sheets into a credit crunch that feeds back into housing. The plumbing is different. The feedback loop that turned regional defaults into a national credit crisis required specific conditions — private-label MBS, leveraged bank exposure, mark-to-market accounting and counterparty risk — that simply aren’t present at the same scale.
Regional pain stays regional because there’s no transmission mechanism.
The AirBNB Unwind
A related supply thesis argues that failing Airbnb and short-term rental operators will flood the market as revenues decline from their 2022 peaks. This narrative has been circulating since mid-2023 — and the wave of forced selling still hasn’t arrived. The math explains why. AirDNA identifies roughly 1.5 million active short-term rentals in the U.S. at any given time, against a total housing stock of 147 million units — that’s about 1.6%. Even a meaningful shakeout among amateur hosts adds a fraction of a percent to national inventory. And the properties most likely to convert are concentrated in the same leisure markets — Scottsdale, Sevierville, parts of Florida — already showing regional softness. The STR unwind is real in those pockets. But it’s not a mechanism for national price declines.
The Credit Stress Spillover
So if the correction isn’t going to come from a supply, it has to come from the household side.
The argument: credit stress is building in auto loans, credit cards, and student debt have been growing and will eventually spill into housing.
The stress is real. Auto loan delinquencies hit 5.2% at 90+ days in Q4 2025 — the highest since 2010. Credit card delinquencies reached 12.7% delinquent, the highest in 14 years. Student loan delinquencies spiked to 10.2% after forbearance ended.
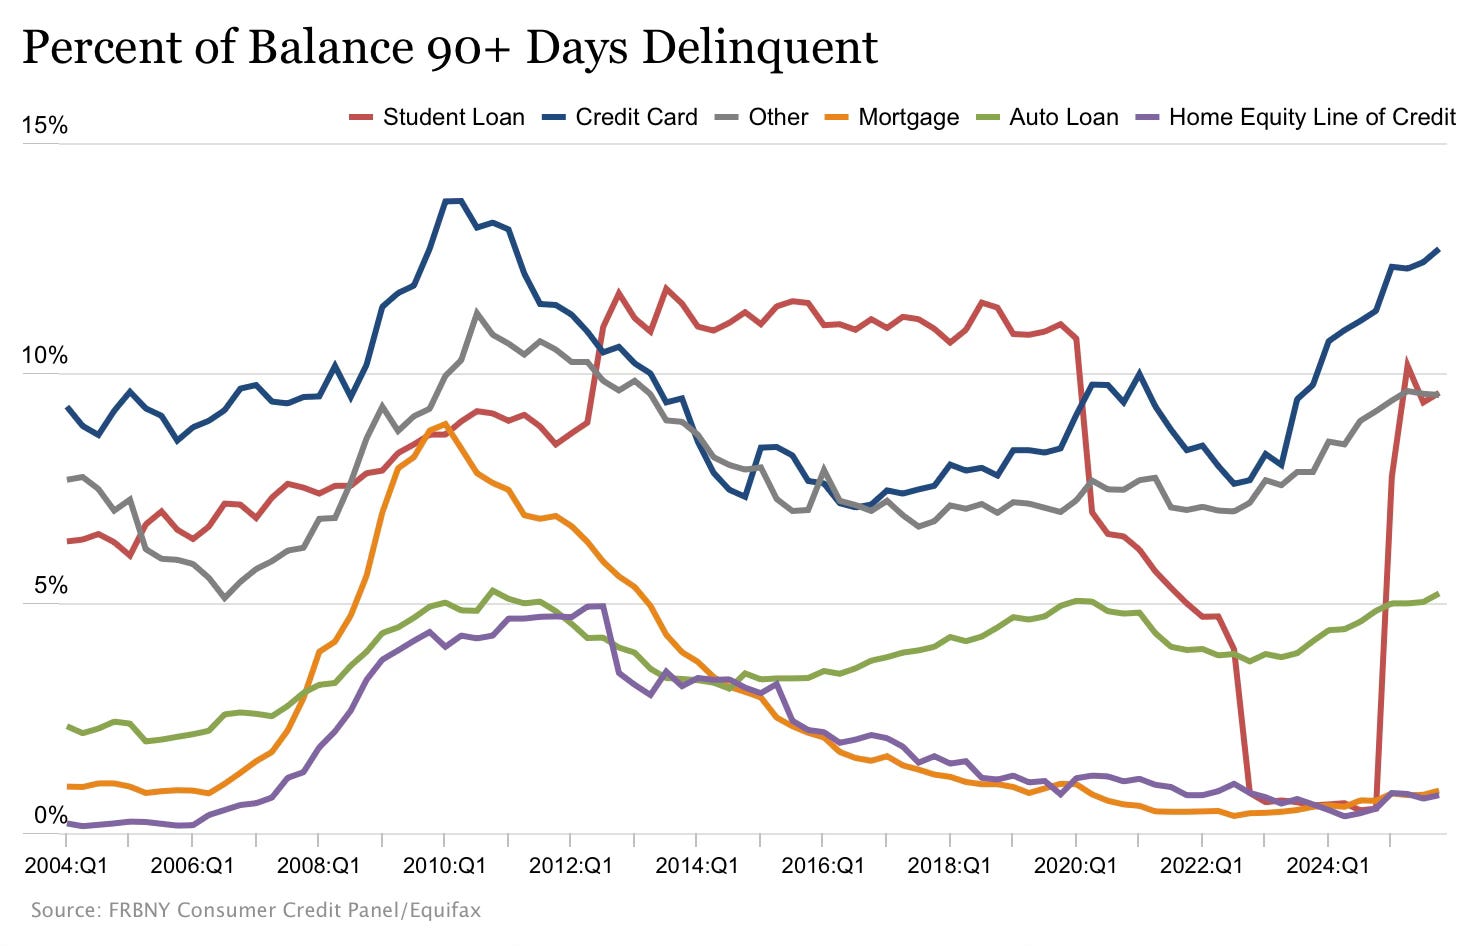
There’s an important hierarchy here. When households get squeezed, they triage. Credit cards go delinquent first — they’re unsecured, the consequences are manageable and the issuer has no collateral to seize. Auto loans come next. The mortgage is the last bill to go, because losing your home means losing everything. This priority stack is why credit card delinquencies can spike without mortgage delinquencies following. It’s not that households aren’t stressed. It’s that the stress shows up in unsecured credit long before it threatens housing. And the data confirms it: credit card delinquencies at 14-year highs, mortgage delinquencies at 0.9%. The stress is real but it’s not in the right place to crash home prices.
Credit stress has to translate into forced selling to move prices. Not stress alone. Not tight budgets. Not unhappy households. Forced selling — specifically, homeowners who can’t make payments and have to sell. And that mechanism requires negative equity or severe income loss.
Foreclosure filings did rise 14% in 2025, totaling 367,460. That spooked people. But foreclosure filings represent just 0.26% of all housing units and that’s still 86% below the 2009 peak of over 2.1 million. These numbers are up from pandemic lows, but they’re not accelerating in the way that signals systemic stress.
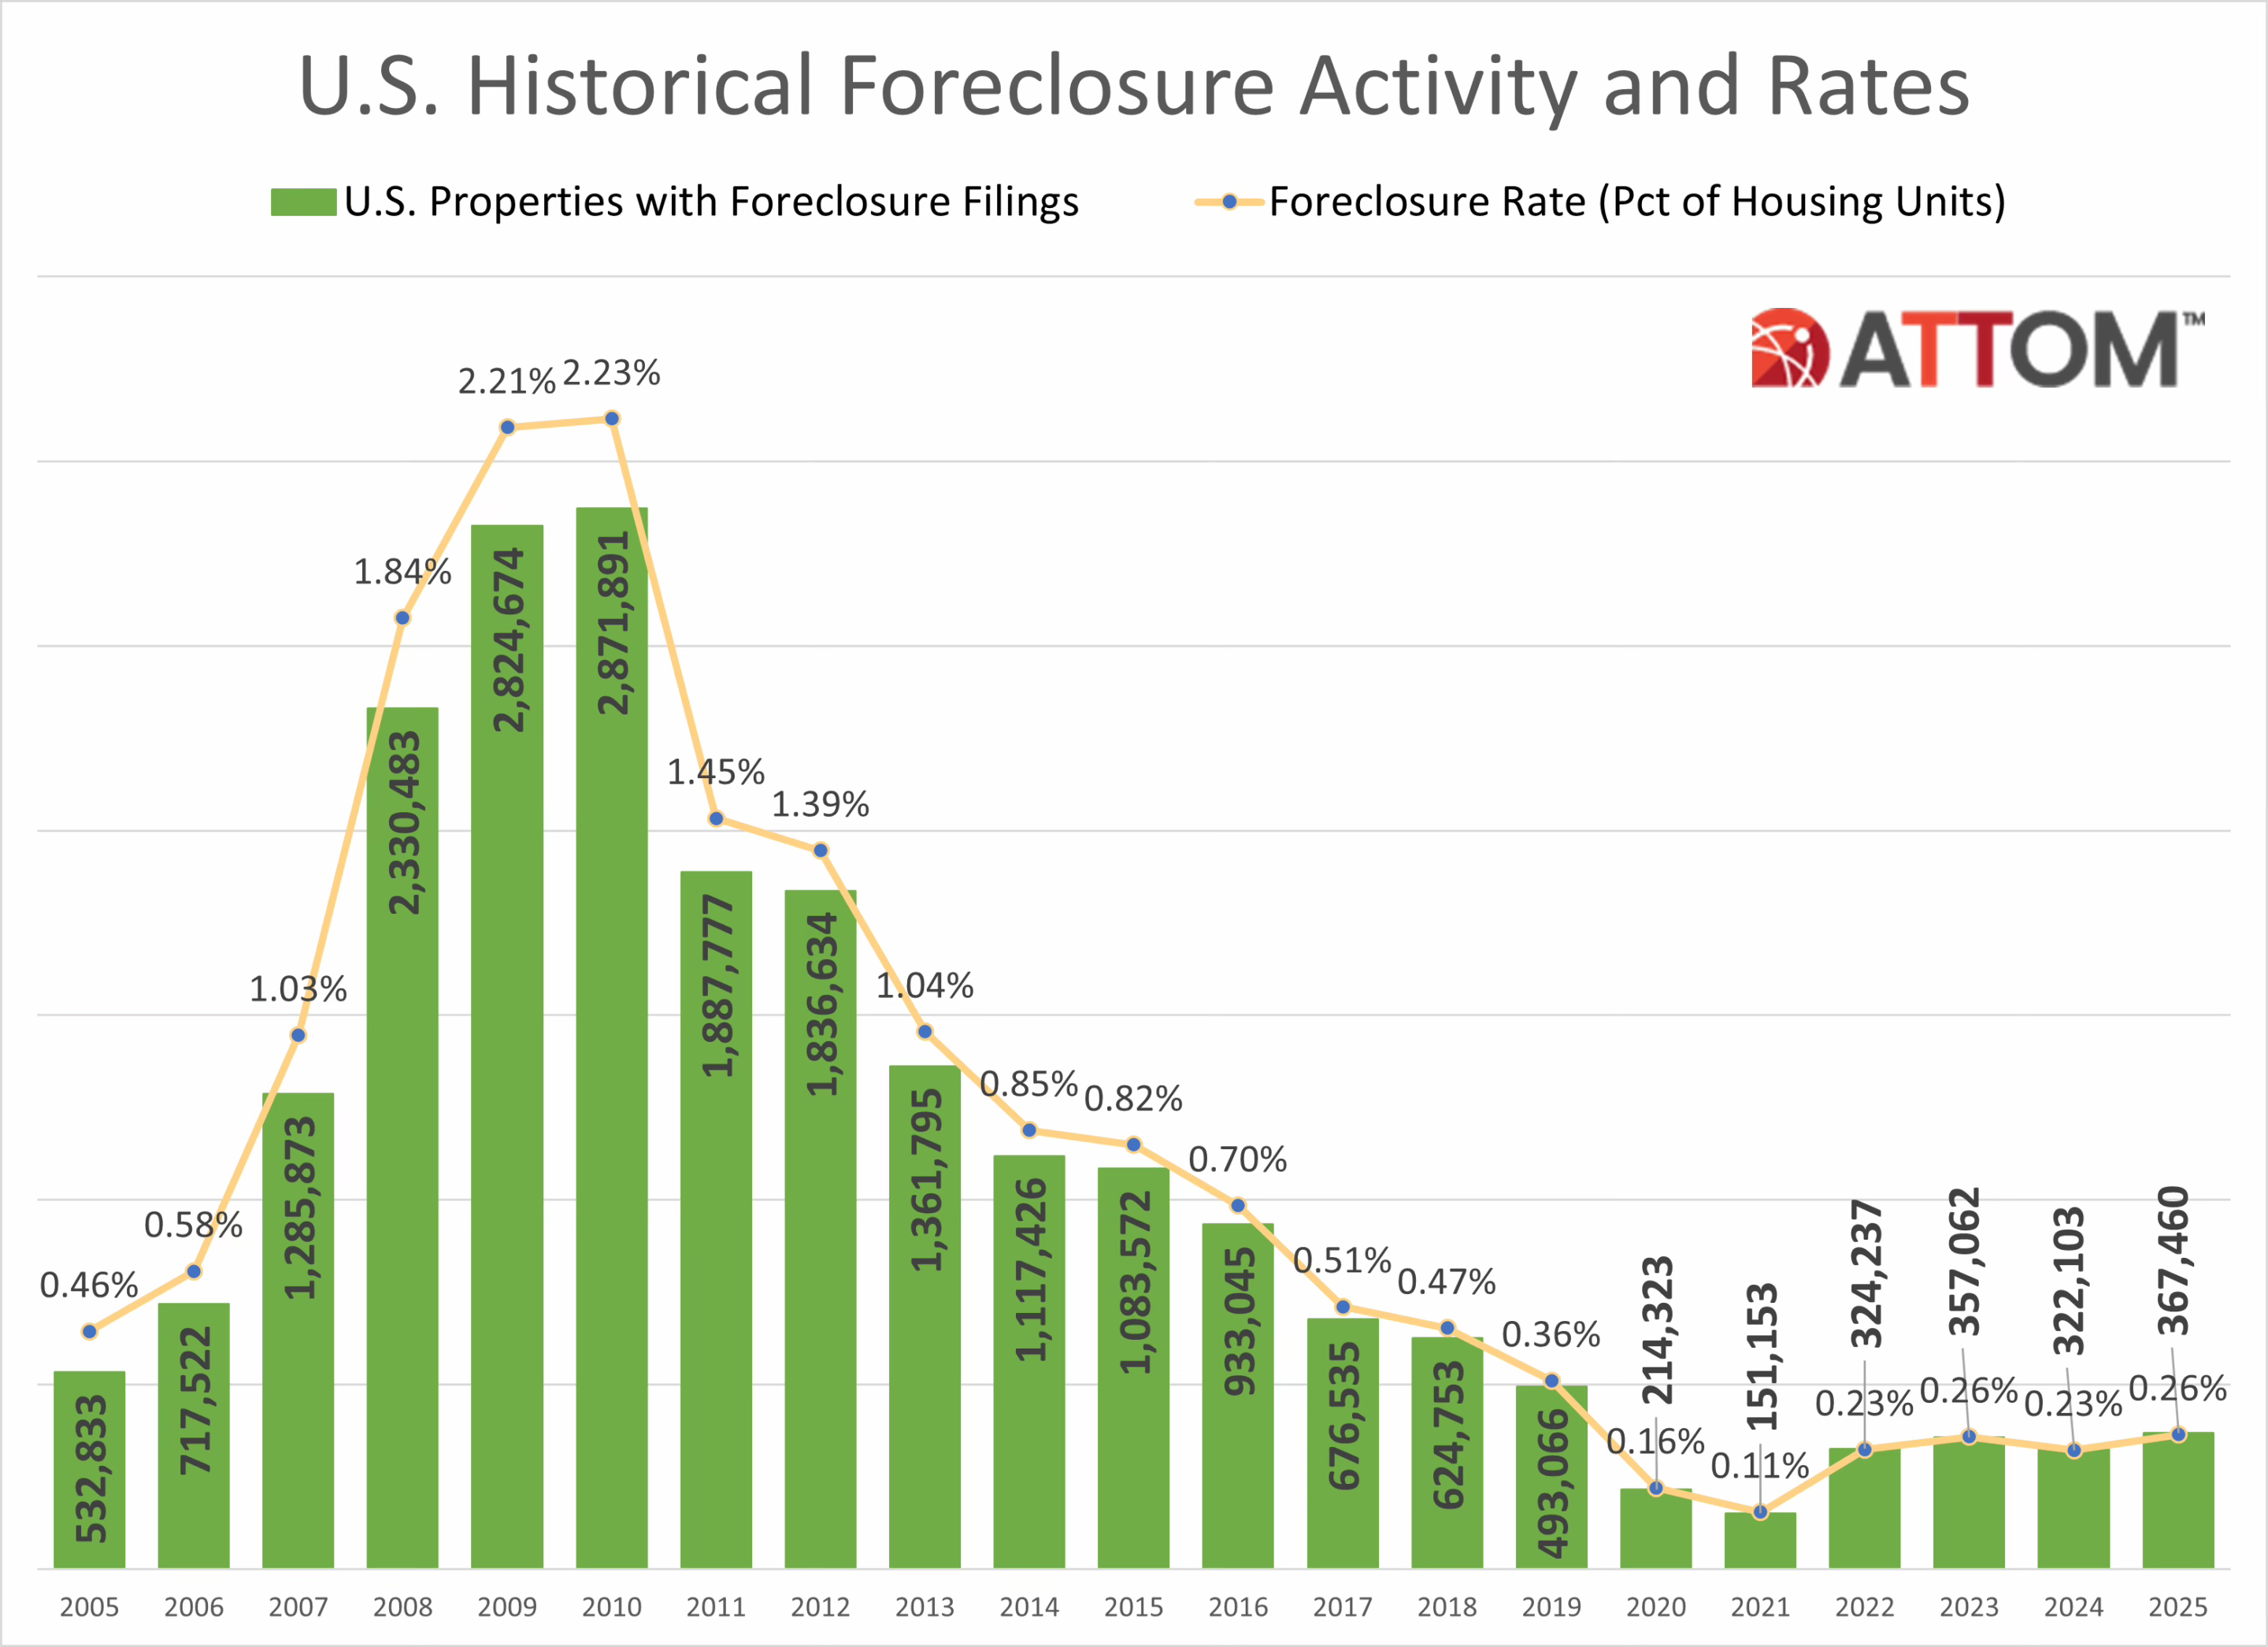
The bears would argue that a 14% annual increase is what the early innings look like. Fair enough — so look at what the early innings actually looked like last time. In 2006 and 2007, foreclosure filings weren’t rising 14% annually. They were doubling and tripling quarter over quarter. The acceleration curve went vertical well before the housing market actually broke. What we’re seeing today is normalization from artificially suppressed pandemic levels, not the exponential ramp that precedes a crisis.
When you see a real correction coming, the foreclosure data goes vertical early. The credit reports start showing distress 6 to 18 months before the housing market actually breaks.
That process hasn’t even started.
The Slow Fade
If the housing market corrects — and it might — it won’t look like 2008. There’s no supply glut coming. There’s no ARM reset wave. There’s no leverage chain to transmit regional distress nationally. The mechanisms that crashed prices last time aren’t present, and the household balance sheet is strong enough to prevent forced selling at scale.
But a market that doesn’t crash can still erode.
The more likely path is a slow fade: real price declines of 0.5–3% annually, compounding over a decade, without ever triggering the crash indicators everyone is watching for. A market that grinds sideways or slightly up in nominal terms while bleeding in real terms. Prices that don't collapse because there's no forced selling — but that don't accelerate because affordability has restrained demand, mobility is frozen and credit is being rationed toward other priorities.
This is harder to see. And harder to trade. But from a policymaker’s chair, it might be exactly what you’d design if you could.
A nominal crash destroys Boomer retirement equity — the single largest voting bloc in America sitting on the single largest asset class. That’s politically unsurvivable. But flat nominal prices with 3% inflation deliver a 26% real price decline over a decade without a single headline about falling home values. Affordability gradually improves. Retirees see stable account balances. First-time buyers slowly gain ground. Nobody riots.
This is what financial repression looks like in housing. As I argued in a previous piece, we’ve entered a regime where government has both the tools and the political will to manage housing markets through jawboning, directed credit, GSE policy and Fed-Treasury coordination. The slow fade isn’t a market failure. It may be the policy working exactly as intended — improving affordability through real erosion while keeping nominal prices stable enough that no one’s retirement gets blown up.
The housing doomers are watching for the wrong signal. There is no crash coming — not because the market is healthy, but because the correction is taking a form that doesn’t show up in a headline. Those waiting for 2008 to repeat will wait forever. The correction isn't coming as a crash. It's coming as a decade of slow erosion that never triggers an alarm — because it was designed not to.
Share this with someone who keeps telling you housing is about to crash!
Housing + Markets publishes analysis at the intersection of housing, capital markets, and financial history. No crash porn. No cheerleading. Just the data and the mechanisms underneath.
Sources and Further Reading
Housing Supply & Inventory
Weekly New Listings Data — Altos Research / HousingWire
New Home Sales & Completed Inventory — Census Bureau via FRED
Housing Starts — Census Bureau via FRED
Why Can’t We Build More Housing? — Logan Mohtashami, HousingWire
Silver Tsunami
Why Inherited Homes Won’t Solve the Housing Crisis — Cotality (340,000 inherited transfers, 7% of all transfers)
A Silver Tsunami Won’t Solve Housing Affordability Challenges — Zillow Research (geographic mismatch analysis)
Freddie Mac: The Silver Tsunami Will Be a Gradual Reduction — ResiClub / Freddie Mac (9.2M fewer boomer households by 2035)
AARP Home and Community Preferences Survey 2024 — (75% of adults 50+ plan to stay in current homes)
Don’t Count on the Silver Tsunami for Housing Inventory — HousingWire (MBA: ~250,000 units/year)
Regional Corrections
Existing Home Sales by Metro — National Association of Realtors
Credit Stress
Household Debt and Credit Report — Federal Reserve Bank of New York (auto loan, credit card, student loan delinquencies)
Mortgage Delinquencies — Federal Reserve via FRED
2025 Foreclosure Activity — ATTOM Data (367,460 filings, 14% increase, still 86% below 2009)
Mortgage Market Structure
Agency MBS Market Share — Urban Institute Housing Finance Chartbook (70%+ agency-backed)
FHFA Outstanding Mortgage Statistics by Rate — FHFA National Mortgage Database
Household Balance Sheet
Household Debt Service Payments as % of Disposable Income — Federal Reserve via FRED
Real Median Household Income — Census Bureau via FRED
Analysis & Further Reading
Logan Mohtashami’s 2026 Housing Forecast — HousingWire
Why Didn’t We See a National Home-Price Correction in 2024? — Logan Mohtashami, HousingWire
The Homebuilders’ 2025 Supply and Demand Problem — HousingWire
Housing prices are not going to crash provided the lack of sufficient supply provided the demographics of the USA