

The 18-Year Land Cycle: Can We Forecast the Next Market Crash?
Part I: The Prediction, The Pattern and Why I'm Skeptical


The Prediction Everyone Missed
In 1997, while Alan Greenspan worried about “irrational exuberance” and the world was getting drunk on internet stocks, an economics professor at San Jose State University made what should have been an impossible prediction.
Fred Foldvary, writing in the American Journal of Economics and Sociology (a publication so obscure most economists haven’t heard of it), stated with remarkable specificity:
“The next major bust, 18 years after the 1990 downturn, will be around 2008.”
Think about that for a second. This was 1997. The Asian financial crisis hadn’t even peaked yet. The dot-com bubble had barely started inflating. Amazon was three years old and hemorrhaging money on every book sale. And here’s this guy saying with a straight face that he can predict a major economic crisis 11 years out.
He wasn’t alone. Fred Harrison, a British economist who’d spent decades studying land values, published a book in 2005 with the admirably direct title Boom Bust: House Prices, Banking and the Depression of 2010. Phillip Anderson, an Australian real estate analyst, made similar warnings about property markets peaking around 2007-2008.
We all know what happened next.
All three were working from the same playbook: an 18-year cycle in land values that Homer Hoyt first documented in 1933 when he published 100 Years of Land Values in Chicago. Hoyt found something that shouldn’t exist in efficient markets—a pattern of booms and busts that spaced themselves out with almost clockwork regularity.
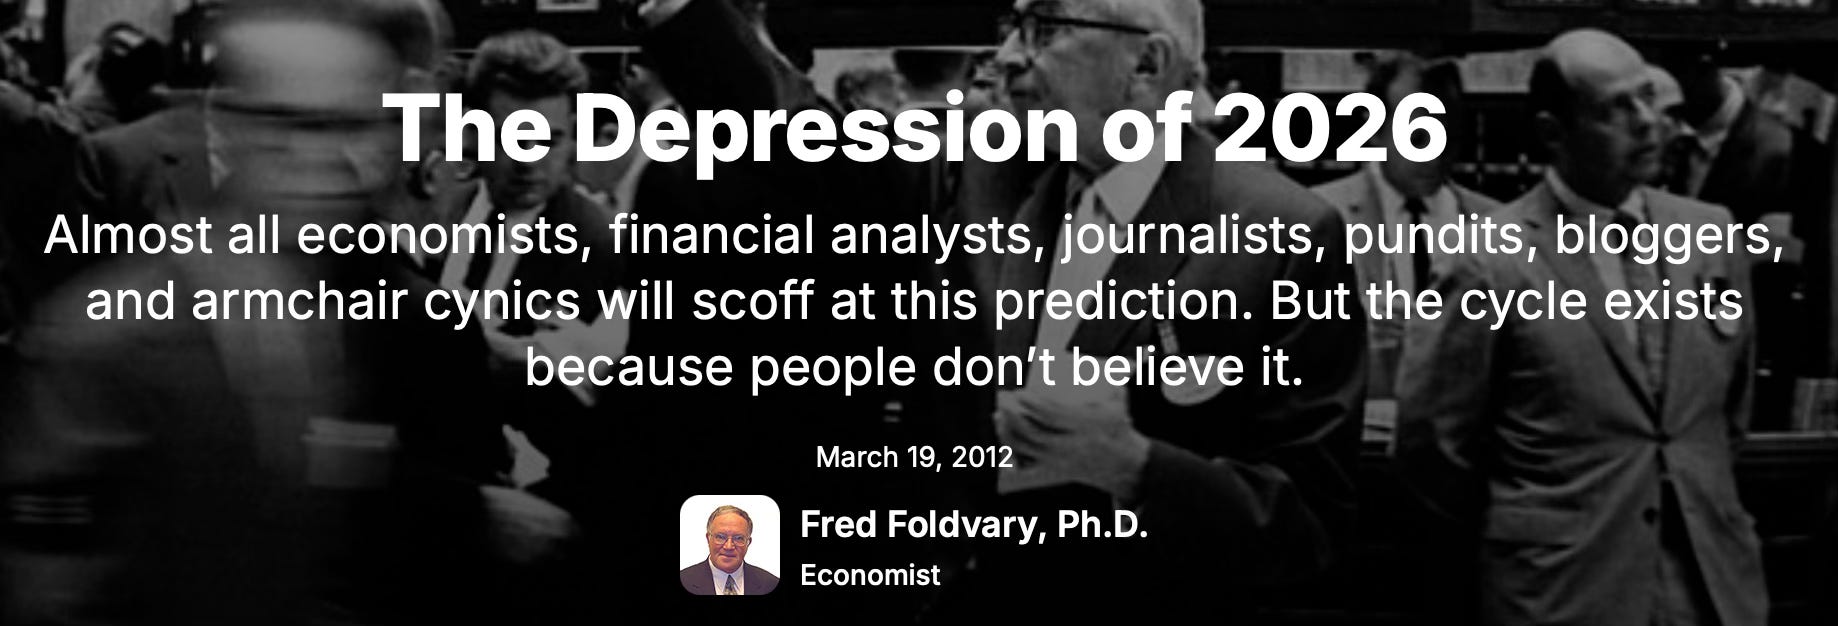
After 2008 proved them right, Foldvary made another prediction in 2012:
The next peak would arrive in 2026. Exactly 18 years later.
On the surface, this looks pretty damn impressive. Three guys, working independently, using the same historical pattern, correctly called the timing and nature of the 2008 crisis years before it happened. That’s the kind of track record that gets people’s attention.
But here’s what makes me pause. We’re working with exactly 10 data points spanning 225 years, and one of those “cycles” lasted 48 years—longer than any two normal cycles combined.
That’s not enough data to prove anything. You need dozens or hundreds of observations to claim you’ve found a real pattern. With 10 noisy data points and one massive exception, you could be looking at signal or you could be looking at random clustering. Pattern-matching is what human brains do best, after all.
What I find more interesting than the 18-year number is the mechanism underneath it. Credit extended on land speculation. Central banks amplifying the cycle. Institutions systematically forgetting what happened last time. That mechanism is real, well-documented and operating right now as I write this in late 2025.
The question isn’t whether credit-fueled land bubbles eventually blow up. They always do. The question is whether they blow up on a predictable 18-year schedule, or whether that’s just a nice story we tell ourselves about coincidental timing.
We’re living through the test case right now. If the pattern holds, we should already be seeing warning signs. Land prices peaking. Credit tightening. Banks getting nervous. And we are seeing those things. But does that validate an 18-year cycle, or does it just confirm that late-stage credit bubbles tend to look similar regardless of when they happen?
Let me walk you through why I think the mechanism matters way more than the supposed periodicity.
What We’re Actually Measuring
First, let’s be clear about what the cycle is supposed to track. The 18-year pattern is about peaks in land values, not market crashes. This is an important distinction that often gets lost.
According to the theory, land values peak roughly every 18 years. The financial crises that follow can happen immediately or years later. Sometimes you get a 1973 situation where the recession hits right at the peak. Other times you get a 1925 situation where Florida land crashes but the stock market keeps partying for another four years before everything implodes in 1929.
This variable lag is simultaneously the theory’s greatest strength and its fatal weakness. It explains why you can see the train coming (land peaks first) but can’t actually time when it hits you. You might identify the peak in hindsight, but good luck trading on it in real-time.
The Historical Pattern: Let’s Look at What We Actually Have
Here’s what the record shows according Foldvary (he published this in May 2007):
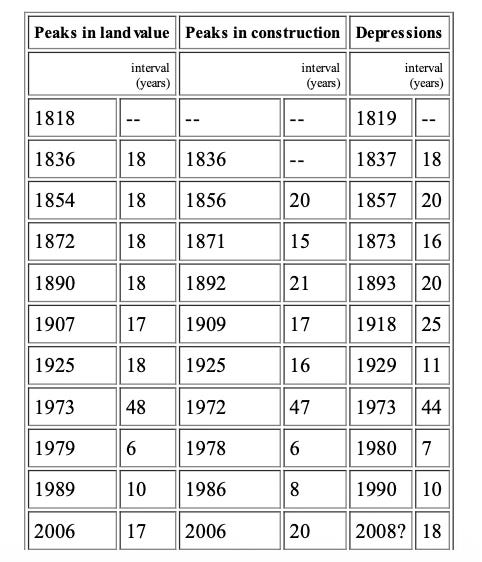
Source: The Depression of 2008, Fred Foldvary
Look at what we’re dealing with here. Five 18-year intervals. Two that came in at 17 years. One massive 48-year exception. And then this completely bizarre sequence in the 1970s where you get peaks in 1973 and 1979, only six years apart, followed by a 10-year cycle from 1979-1989.
Now let me point out the problems:
The sample size is tiny. Ten or eleven observations (depending on how you count the 1970s or if you think there was a cycle between 1800-1818) over 225 years doesn’t prove anything. To claim you’ve found a real pattern, you need dozens or hundreds of cycles. With this little data, you’re basically looking at noise and calling it signal.
The 48-year gap is a killer. If external events can “pause” the cycle for half a century, then it’s not really a cycle at all. It’s just a description of what happens when credit-fueled land speculation runs wild until it crashes. Which is... not exactly a groundbreaking insight.
The 1970s are a complete mess. After the 48-year interruption, you get a land peak in 1973, then another one in 1979, just six years later, then 1989 is ten years after that. The cycle theorists themselves can’t even agree on what happened here. Foldvary thought there was an interruption caused by the inflation shock of the 1970s—essentially another mini-reset within the larger cycle. Harrison and Anderson call it a “mid-cycle pause,” which is... let’s be honest, that’s pretty handwavy. When your theory’s leading proponents can’t agree on how to interpret a major chunk of your data, that’s a problem.
The early data is sketchy. For the 19th century, we don’t have actual land price indices. What we have are historians like Harrison and Anderson looking at federal land sales, building permits, and crisis timing to work backward and infer when land values peaked. That’s fine as historical research, but it’s inherently circular when you’re trying to prove a predictive theory. You’re identifying land peaks based partly on when crashes happened, then using those peaks to predict crashes. See the problem?
The 1973 peak doesn’t fit the mechanism. The 1973-75 recession was triggered by OPEC oil embargoes and the Yom Kippur War, not land speculation. Calling this a “land cycle peak” is really stretching things. Sure, you can argue that commodity inflation and land cycles are somehow related, but that’s post-hoc rationalization.
That said, if you squint at it the right way and ignore the 1970s weirdness, you do see a rough clustering in the 16-20 year range for most cycles. That’s not nothing. It’s just also not proof of an 18-year law.
What makes this worth taking seriously isn’t the precise timing. It’s the mechanism that supposedly drives it. So let’s dig into that.
The Mechanism: Credit, Land, and Central Bank Gasoline
If you want to understand why boom-bust cycles happen, you need to understand three things working together: how land gets turned into a financial asset, how credit amplifies speculation, and how central banks pour gasoline on the whole thing.
Land: Turning Location into Money
Land is weird. It’s the one thing you genuinely can’t make more of. You can train more workers. Build more factories. Develop new technology. Even print more money. But you can’t create more beachfront in Malibu or more blocks in Manhattan.
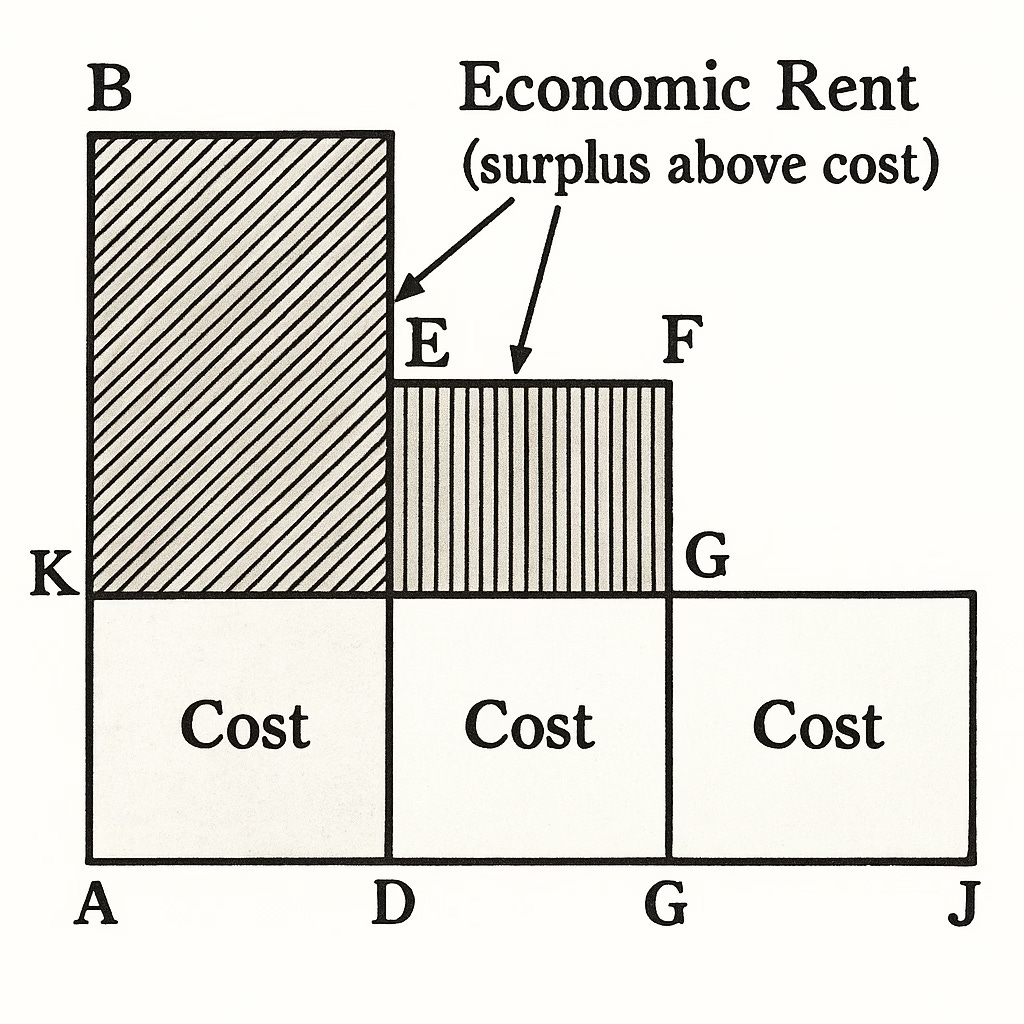
This fixed supply creates what economists call “economic rent”—the surplus that comes purely from location advantage, not from anything productive you’re actually doing.
Think about two identical coffee shops. One’s in Midtown Manhattan paying $50,000 a month in rent. The other’s in Kansas City paying $5,000. The Manhattan shop isn’t making better coffee. It’s not managed better. It just happens to sit where millions of people walk by every day. That $45,000 difference is pure location rent—value created by everyone else’s economic activity, captured by whoever owns the land.
Here’s the part most people don’t think about, property ownership is just a government-granted license to exclude everyone else from a specific location. That’s all it is. And property taxes? They’re not just some cost of doing business—they’re the ongoing price you pay to maintain that exclusion right. Stop paying and see how long you keep that “ownership.”
This structure does something important, it lets you turn economic rent from an income stream into a tradeable financial asset. Once that happens, land becomes subject to all the same speculation and leverage dynamics as any other financial asset.
And here’s the kicker. Residential land makes up 40-75% of total real estate value in advanced economies. That share has been rising since 2011. When researchers looked at house prices across 14 advanced economies over 140 years, they found something striking: nearly all the long-run price appreciation came from land, not structures. Buildings depreciate. Land appreciates.
This is why it’s fundamentally a land cycle, not a real estate cycle. When credit expands, it’s not financing better buildings. It’s financing higher land prices. The buildings are just the packaging.
Credit: The Reflexive Feedback Loop
If people could only buy land with cash they had sitting around, prices would be constrained by current incomes. Nothing too crazy could happen. But credit changes everything.
With leverage, buyers aren’t limited by what they earn today. They’re limited by what lenders think they might be able to pay tomorrow. And that creates a feedback loop that works beautifully until it doesn’t.
Here’s how it goes:
Land is worth $100,000. Bank lends $80,000 against it at 80% LTV. Then land appreciates to $150,000. Suddenly that $80,000 loan only represents 53% of the value. Bank looks at that and thinks “wow, this is really safe lending!” So they lend more. More credit availability brings more buyers into the market. More buyers push prices higher still. Higher prices make lending look even safer.
Each uptick validates the previous lending decisions and encourages more aggressive lending at higher valuations. And here’s where it differs from normal business lending: when a bank lends to a manufacturer, the loan’s viability depends on whether that business generates cash flow from operations. But when a bank lends against real estate, the loan’s apparent safety increasingly depends on continued price appreciation rather than the property’s ability to generate income.
The system works wonderfully on the way up. Everyone makes money. Everyone looks smart. Then prices stop rising.
Once that happens, the whole thing runs in reverse. Lending standards tighten. Fewer buyers can get financing. Demand falls. Prices drop. The same reflexivity that powered prices upward now drives them down. And because everyone borrowed against rising values, a lot of people who looked solvent at the peak suddenly look insolvent at the trough.
This isn’t new. This has been happening for centuries. But here’s what amplifies it in modern times.
Central Banks: Systematic Amplification
Economic cycles existed long before central banks. The U.S. had boom-bust cycles in 1819, 1837, 1857, 1873 and 1890. All of that was before the Federal Reserve even existed. So central banks didn’t invent the business cycle.
But what Austrian economists like Hayek and Mises figured out is that central banks make cycles way more violent by systematically distorting interest rates. Let me explain how.
Capital has a time structure. Some investments pay back quickly. Some take years or decades. The economics term for this is “higher-order” versus “lower-order” capital goods. Inventory that turns over every month is low-order. An office tower that takes five years to develop and then sits on your books for decades is high-order.
The higher-order capital goods are exponentially more sensitive to interest rates.
If you’re holding inventory that turns monthly, you don’t really care if interest rates are 3% or 6%. Your capital isn’t tied up long enough for it to matter much. But if you’re developing a high-rise that won’t generate returns for five years? The difference between 3% and 6% rates is the difference between the project working and the project bankrupting you.
Real estate sits at the highest order of capital goods. Enormous upfront investment. Long construction timelines. Extended holding periods. This makes real estate the sector most sensitive to interest rate changes and therefore most vulnerable to central bank manipulation.
Now here’s where it gets interesting. In a free market, interest rates reflect the time preferences of savers and borrowers or how much society collectively values consuming today versus consuming tomorrow. Low rates signal that people are saving a lot, capital is abundant, go ahead and invest in long-term projects. High rates signal that capital is scarce, people want to consume now, don’t tie up resources in decade-long investments.
But when the Fed manipulates rates administratively, it sends false signals throughout the economy. After 2008, the Fed held rates near zero for years. Not because Americans suddenly became more patient and future-oriented. Not because we were all saving like crazy. But because the Fed decided the economy needed stimulus.
Those artificially low rates act as if there’s abundant capital available for long-term investment. Banks, sitting on cheap funding from the Fed, lower their lending rates. At these suppressed rates, all kinds of investments suddenly look viable that wouldn’t make sense at actual market rates. Developers break ground on projects that only pencil with cheap permanent financing. Investors buy properties at cap rates that only work if you can get low-rate debt forever.
Real estate soaks up a disproportionate share of this artificially cheap credit for several reasons. It benefits most from rate suppression because it’s the longest-duration asset. It provides tangible collateral that banks and regulators consider “safe.” It generates ongoing cash flow that can service debt. And banks understand the underwriting models.
So when the Fed suppresses rates, real estate booms. Prices rise. Collateral values increase. Lending standards loosen. Everything gets turbocharged by cheap credit.
Then the bill comes due. Those new investments—the office towers, apartment buildings, data centers—they all compete with consumption for real resources. Steel, copper, concrete, labor, energy. This competition drives up costs. Eventually consumer price inflation appears, revealing that the investment boom wasn’t backed by real savings at all. Society didn’t actually choose to defer consumption. The central bank just made it look that way through rate manipulation.
The Fed, facing rising inflation and political pressure, has to respond. It lifts rates. The term structure adjusts. Suddenly projects that made sense with 4% money need to refinance at 6%. Properties purchased at 4.5% cap rates need to trade at 6.5% caps to attract buyers. The malinvestment becomes obvious. Sponsors default. Developers hand keys back to banks. Lenders, now worried about real estate exposure, tighten standards. The credit spigot that powered the boom shuts off completely.
Prices fall as buyers can’t get financing and sellers are forced to meet debt obligations. Then, facing recession and unemployment, the Fed cuts rates again. And the whole cycle starts over.
What’s Up With the 18 Years?
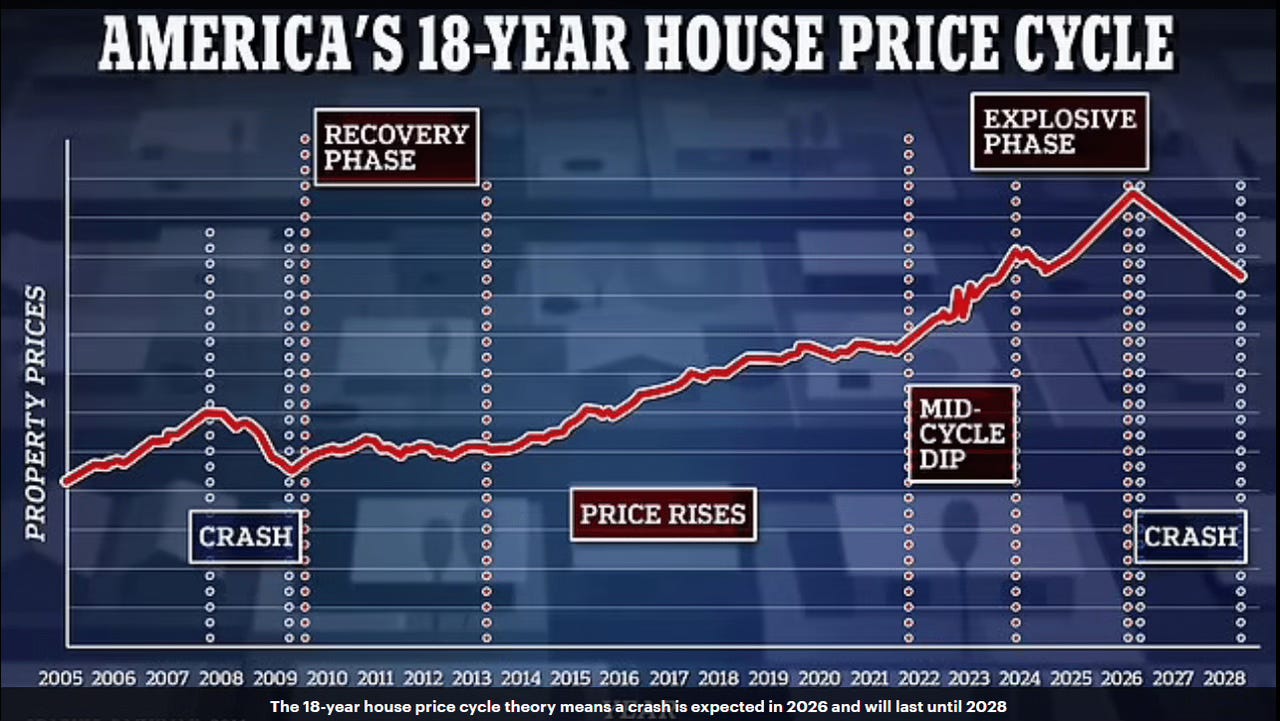
Source: Fred Harrison, The Daily Mail
Here’s where we need to get honest about what we actually know versus what makes a good story.
The cycle theorists point to three mechanisms that supposedly converge around 18 years. Let me show you why I’m skeptical of each:
Financial compounding. At 5% rates, credit doubles every fourteen years. Fine, but that gives us 14 years, not 18. And interest rates haven’t been consistently 5%—they’ve ranged from near-zero to double digits. So this “clock” ticks at wildly variable speeds depending on the era.
Physical and capital deployment lags. Research shows it takes about 15 years on average for land to go from farmer to investor to developer. Add construction time, and you get... 15-17 years, not 18. And that’s an average—individual projects vary from 8 to 25 years depending on complexity, regulation, and market conditions.
Institutional memory and generational turnover. This one I actually buy. Fifteen to twenty years is roughly how long it takes for people who lived through a crisis to retire and get replaced by people who only studied it. But this is the least precise of the three mechanisms—it’s not a clock, it’s a slow fade.
Look, none of these mechanisms naturally produce an 18-year cycle. They produce something in the 14-20 year range, which is... not the same thing. The theorists are reverse-engineering an explanation for a pattern they’ve already decided exists.
Here’s my take: There probably IS a natural rhythm to credit-fueled land bubbles based on leverage accumulation, construction lags, and institutional forgetting. But it’s not a metronome. It’s more like a drunken pendulum swinging somewhere between 15 and 25 years, occasionally getting knocked off course entirely by external shocks.
The 18-year number is suspect. But credit-fueled land bubbles keep blowing up with depressing regularity anyway.
The Half-Life of Financial Memory
You know what’s interesting about the institutional forgetting piece? It’s the only part of this theory that’s actually well-documented with hard data.
The standard warning goes “those who don’t learn from history are doomed to repeat it.” Nice sentiment. But it assumes we’re capable of learning from history. In finance, we’re not. Not because people are stupid, but because the structure of modern finance systematically filters out anyone who remembers.
Do the math. The average job tenure for financial professionals is eighteen months to two years. Over an 18-year cycle, that means the average institution cycles through its entire workforce nine times. Most of the people making decisions today have zero personal experience with the last crisis. They might have studied it in business school. Maybe wrote a case study about it. But they didn’t live through it. They weren’t the ones getting fired when everything blew up.
The Boston Fed actually studied this in 2023. Banks with senior management averaging over 55 years old maintained 23% more capital and posted 31% lower default rates than banks with management under 45. A separate Federal Reserve study from 2003 found something even more striking: for every year that passed since a bank’s last crisis, its commercial lending growth increased by half a percentage point annually. Ten years after a bust, banks were extending 5% more credit per year than right after the crisis. Not because loan demand increased, but because lending standards slowly eroded.
Now overlay typical career arcs. Start at 25. Reach senior decision-making roles around 40. Retire at 65. Over a forty-year career with 18-year cycles, you might experience two full cycles, but you’ll only hold real authority during one of them. Most financial professionals learn about crises from textbooks. A small minority learn from scar tissue.
Here’s an uncomfortable truth, forgetting isn’t just inevitable, it’s profitable. Think about who thrives during expansions. Is it the cautious veteran who keeps mumbling about risk controls and remembering what happened last time? Or is it the aggressive young trader who’s unburdened by all that historical baggage and just sees opportunity everywhere?
Rising markets systematically promote optimists and sideline pessimists. By the time markets peak, the industry has filtered itself for exactly the personality types most likely to drive the whole thing off a cliff.
Then the crash happens and everything reorganizes. The aggressive optimists blow up. Cautious veterans get their brief moment in the sun. Regulations get tightened. Investors swear “never again.” Politicians give speeches about how we’ve learned our lesson.
And then the forgetting starts all over again.
Cautious institutions find themselves losing market share to more aggressive competitors. That starts to look like a problem. Boards get antsy. Activists start circling. Executives who remember the last crisis retire or get pushed out. New management comes in promising to “modernize risk practices” and “unlock shareholder value.” Within a decade, all the lessons have been systematically unlearned.
The cycle doesn’t persist because we can’t learn. It persists because we’ve built institutions that ensure we forget.
The Basel Parable
You see the same dynamic in regulation. After the Latin American debt crisis and the S&L debacle in the 1980s, global regulators got together in 1988 and created Basel I. The framework was beautifully simple. Banks need to hold capital equal to 8% of their risk-weighted assets. You could fit the whole calculation on a napkin.
And it worked. Bank capital levels went up. The system got more stable.
But by the late 1990s, nobody working in finance had personally lived through the crises that created those rules. Basel I started feeling like this relic from another era. Too simple. Too rigid. Not “sophisticated” enough. Banks figured out they could game the system through regulatory arbitrage.
So in 2004 we got Basel II. Instead of keeping it simple, regulators decided to get fancy. Banks could now use their own internal models to calculate risk weights. The logic seemed reasonable: banks know their own portfolios better than regulators do, right?
What actually happened? Banks with shakier capital positions became more aggressive about reducing their reported risk weights. The same mortgage that required 8% capital under Basel I might suddenly only require 1.6% under the bank’s fancy new internal model. Not because the mortgage got safer. Because the model said so.
By 2008, all the major global banks looked well-capitalized under Basel II. Tier 1 ratios above 8%. Everything looked fine. Then Lehman Brothers (sporting an 11% Tier 1 ratio just before it collapsed) imploded overnight. The problem wasn’t that banks didn’t have enough capital. The problem was that risk-weighted assets had been systematically understated through all those sophisticated models.
After the crisis, we got Basel III. Even higher capital requirements. New liquidity ratios. A leverage ratio backstop that doesn’t rely on risk weights. The rulebook now runs to hundreds of pages instead of fitting on a napkin. Surely this time we learned the lesson, right?
Except the pattern’s already repeating itself. In 2023, U.S. regulators proposed the Basel III Endgame rules. The banking industry’s response was immediate and predictable: “These rules will hurt economic growth! They’ll reduce market liquidity! We need carve-outs for [insert special interest here]!” The rules are already being delayed. Watered down. Renegotiated.
Meanwhile, a whole generation of bankers who were in high school during 2008 are now in their mid-thirties and moving into senior positions. To them, Basel III looks like some ancient, bloated regulatory apparatus from a crisis they barely remember.
The cycle isn’t about regulators being incompetent or bankers being greedy—though there’s plenty of both. It’s about the fundamental structure: when institutions forget why rules exist, they don’t just repeal them. They grow around them. Every loophole, every reinterpretation, every “financial innovation” is an act of collective amnesia dressed up as progress.
Next in this series: the Great Interruption to the cycle, the international evidence and what comes next...
“♡ Like” this piece — one more reminder before the forgetting sets in.
Sources and Further Reading
Foldvary, F. (1997). “The Business Cycle: A Georgist-Austrian Synthesis.” American Journal of Economics and Sociology
Foldvary, F.E. (2007). “The Depression of 2008.” The Gutenberg Press
Harrison, F. (1983). The Power in the Land. Shepheard-Walwyn
Anderson, P. (2009). The Secret Life of Real Estate and Banking
Hoyt, H. (1933). One Hundred Years of Land Values in Chicago
Smith & Cole (1935). Fluctuations in American Business, 1790-1860
Newman. The Building Industry and Building Cycles
Berger & Udell (2003). “The institutional memory hypothesis and procyclicality of bank lending.” Journal of Financial Intermediation
Boston Federal Reserve (2023). “Management Age and Bank Risk-Taking”
Ricardo, D. (1817). On the Principles of Political Economy and Taxation
George, H. (1879). Progress and Poverty
Hayek, F. A. (1931). Prices and Production
Mises, L. von (1912). The Theory of Money and Credit
Knoll, Schularick & Steger (2017). “No Price Like Home: Global House Prices, 1870-2012.” American Economic Review