

Decoding the State of Housing: Part I - The Quiet Correction
The For-Sale Market's Quiet Correction


As we come into the end of the year I thought it would be worthwhile to do a deep dive into what the data is telling us about the broader housing markets. The will be another multi-parter where we delve into everywhere housing and markets intersect including multifamily/rentals, capital markets and the consumer and households (this is Housing + Markets after all). For this first part we are going to start with what comes to mind for most folks when they think of housing. The for-sale market. And for a bottom-up analysis there is no better place to start than at the very bottom. In the dirt.
As I’ve written previously, land usually rings the bell early at cycle tops. But it’s messy to track. Every parcel is different on size, zoning, and topography, and there isn’t a clean (public), investable “land index” you can just plug into a dashboard.
Homebuilders are the biggest marginal buyers of land, so their behavior is the most logical place to look. The message from the public builders is clear. They’ve pushed hard into “land-light” models over the last two years. D.R. Horton finished fiscal 2024 controlling about 633,000 lots, only 24% owned and 76% held through land and lot purchase contracts, up from roughly two-thirds optioned a year earlier. Fitch reports that Lennar controlled around 585,000 lots as of early 2025, with only ~9% owned and ~91% controlled via options, up from ~70% optioned in early 2024. Pulte is on the same path: at year-end 2024 it controlled 234,600 lots, 56% under land-option agreements, and management now says options account for about 60% of the pipeline with a target of 70%. Smaller publics like Century Communities and DSLD explicitly describe “land-light” strategies that favor finished-lot option contracts to manage risk.
At the same time, builders have been quietly taking real charges on land and communities that no longer pencil. Pulte booked roughly $35 million of land-related charges in 2024 and $43 million in 2023, defined as land impairments, net realizable value write-downs on land held for sale and write-offs of deposits and pre-acquisition costs. D.R. Horton wrote off $65 million of earnest-money and pre-acquisition costs on terminated land purchase contracts in 2024, after similar $61 million and $67 million hits in 2023 and 2022; that figure jumped to $125 million in 2025. Toll Brothers recognized $15.6 million of land impairment charges in 2023 and another $12.9 million of land and other impairments in 2024, while Tri Pointe has repeatedly broken out “impairments and lot-option abandonments” in its margin bridges, including more than $14 million of charges in 2023 alone. In other words, management teams aren’t just talking about being cautious on land. They’re paying real money to walk away from deals and mark down dirt that no longer supports peak-cycle underwriting.
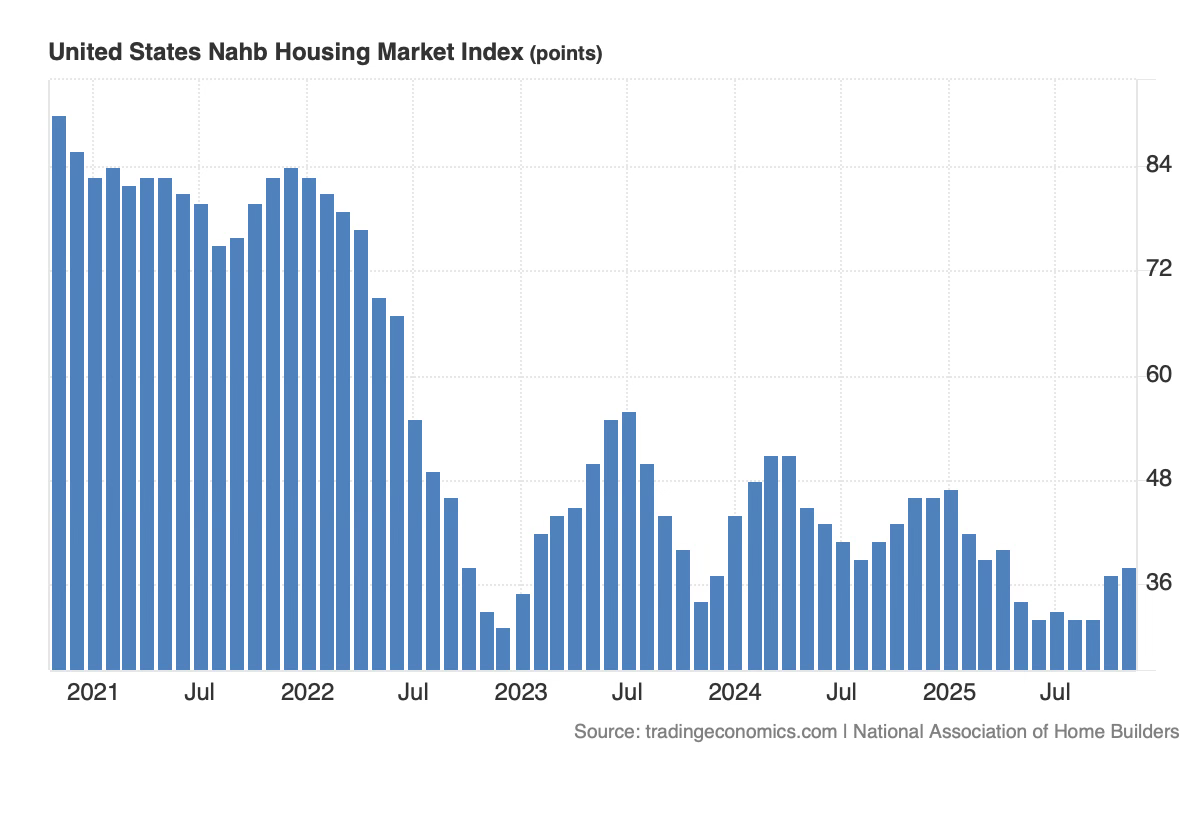
That posture shows up in sentiment. The NAHB/Wells Fargo Housing Market Index has spent most of 2025 stuck in the high-30s to low-40s, well below the 70+ readings of 2020–21 and below the 50 line that separates “good” from “bad.” Builders aren’t just moody. They’re behaving like people who think the easy part of the cycle is behind them.
And they’re walking away from real capital to do it.
Across the group, builders have been quietly taking charges on land and communities that no longer pencil. Pulte booked roughly $35 million of land-related charges in 2024 and $43 million in 2023 (impairments, NRV write-downs, deposits/pre-acquisition write-offs). D.R. Horton wrote off $65 million of earnest-money and pre-acquisition costs on terminated land purchase contracts in 2024, after similar $61 million and $67 million hits in 2023 and 2022; that figure jumped to $125 million in fiscal 2025. Toll Brothers recognized $15.6 million of land impairment charges in 2023 and another $12.9 million of land and other impairments in 2024, while Tri Pointe has repeatedly broken out “impairments and lot-option abandonments” in its margin bridges. In other words: management teams aren’t just saying they’re cautious on land. They are marking down dirt and walking away from deals.
The earnings calls tell the same story in a different language. Margins. During the COVID boom, large publics were printing mid-20s homebuilding gross margins. Lennar’s pre-impairment homebuilding margin was ~25% in Q4 2022, slipped to 24.2% in Q4 2023, and fell again to 22.1% in Q4 2024. By mid-2025, Lennar’s gross margin on home sales in some quarters had fallen into the high teens as incentives and rate buydowns chewed through pricing power. D.R. Horton tells a similar story: its home-sales gross margin has stepped down from around 24% in 2024 to roughly 21–22% in 2025, with management explicitly pointing to higher incentives and mortgage-rate buy downs.
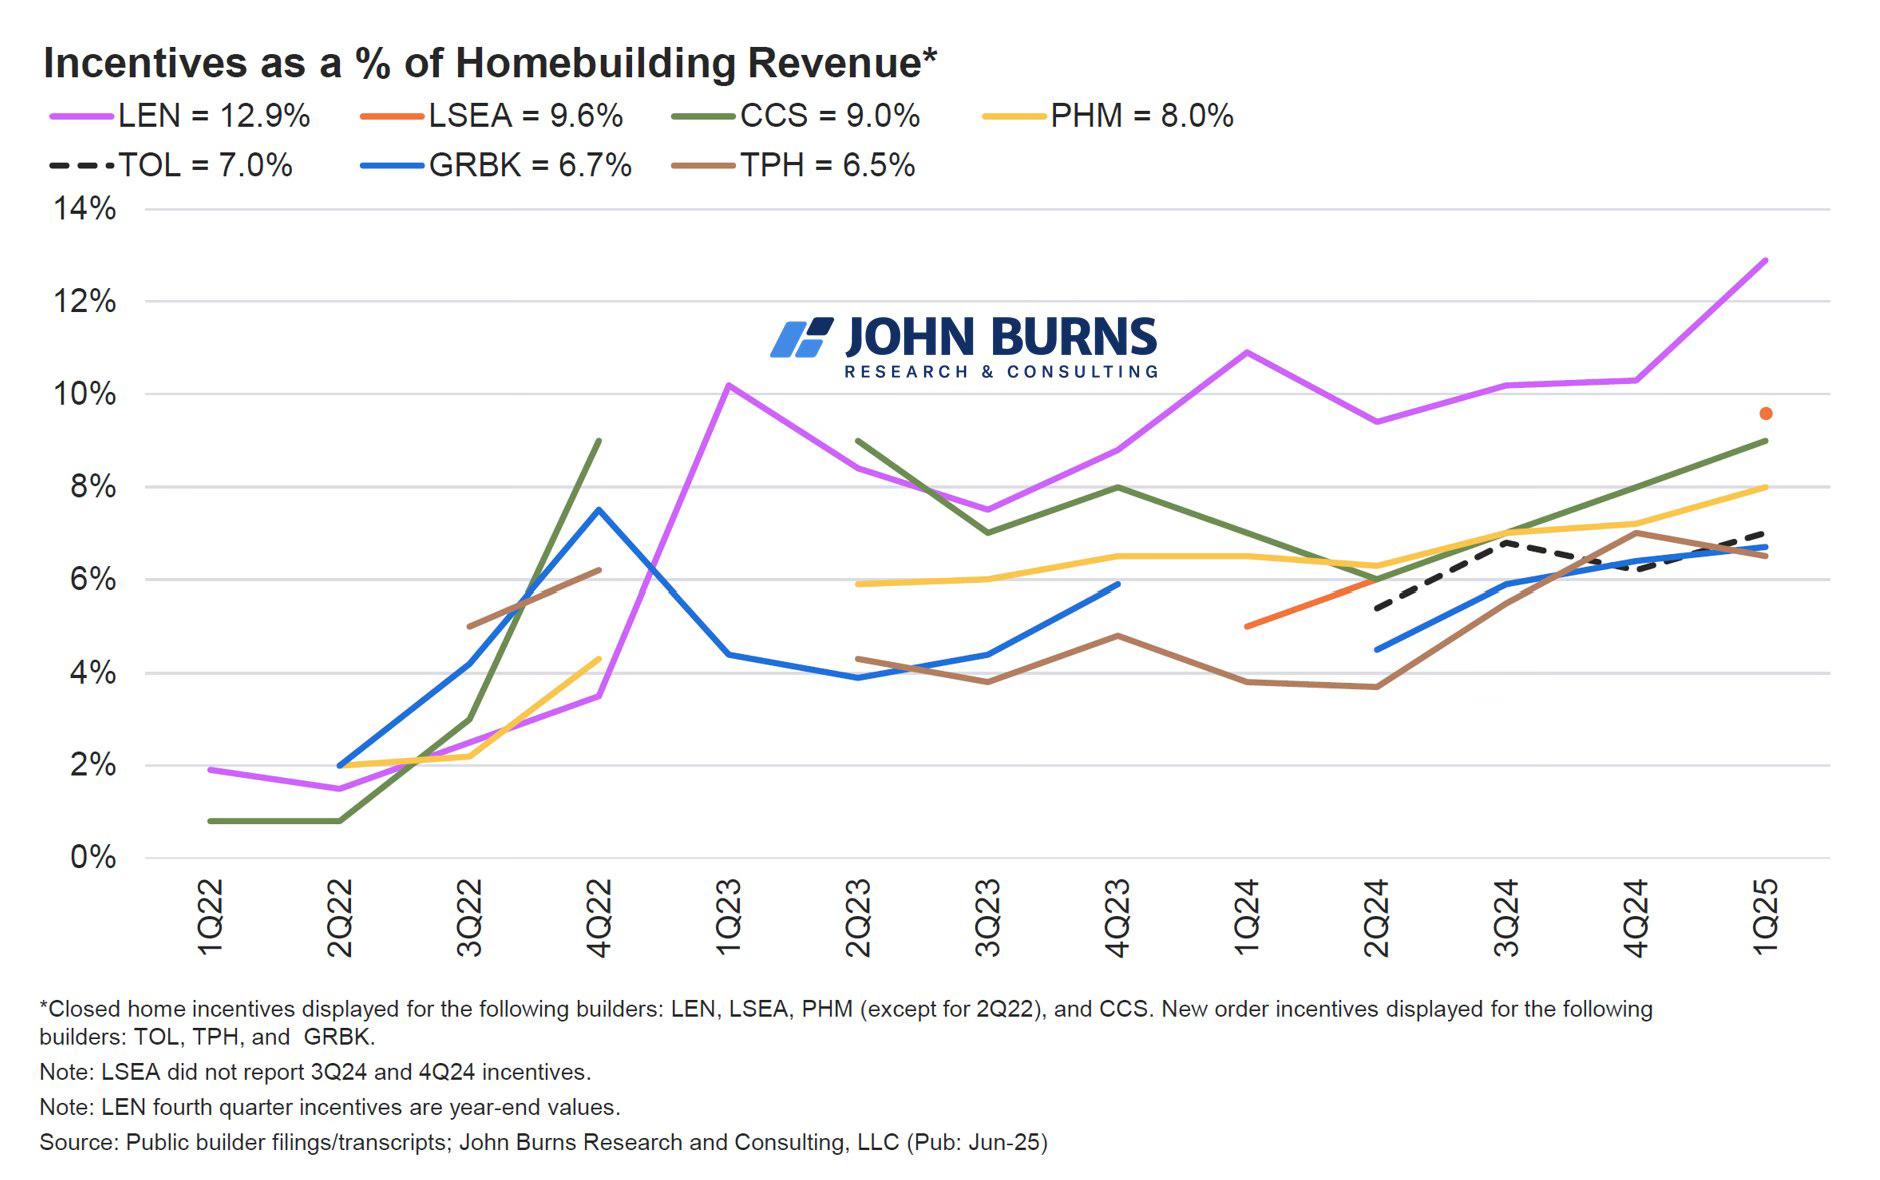
The real story here is incentives, not list prices. Official average selling prices can look flat to slightly up, but net prices after buydowns and credits are under real pressure. Lennar disclosed incentives averaging about 13% of the sales price in Q1 2025 and 13.3% in Q2, more than double what management describes as “normal.” The result is straightforward: builders are holding the sticker, cutting the deal underneath it, and you see the cost show up in compressed margins.
All of this is happening against the backdrop of more product that needs to move. New-home inventory has rebuilt meaningfully, and the stock of completed homes is back to levels last seen around the post-GFC period. For example, Census data shows to completed, ready-to-occupy inventory hitting the highest level since 2009 in mid-2025.
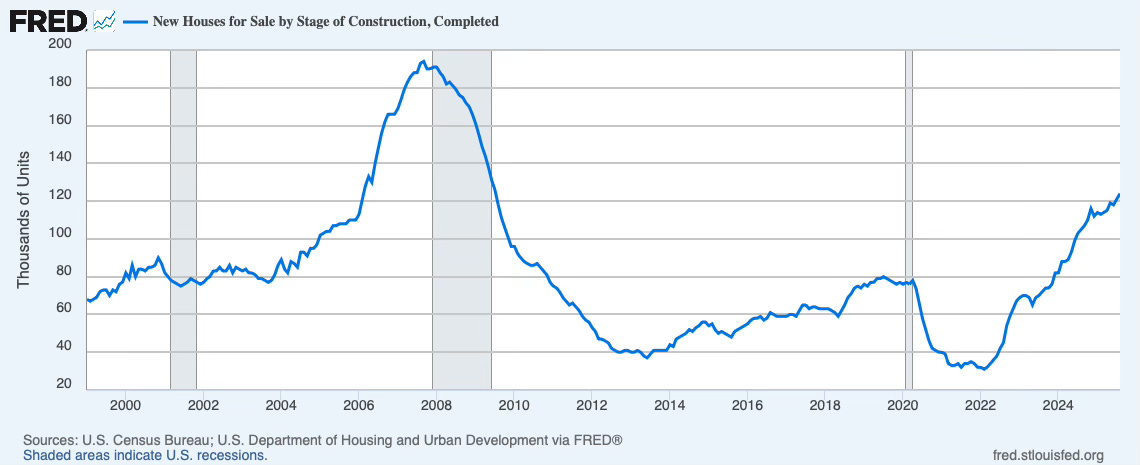
That of course doesn’t guarantee a crash, but it does mean builders have less room to “wait out” demand the way they could when inventory was razor-thin.
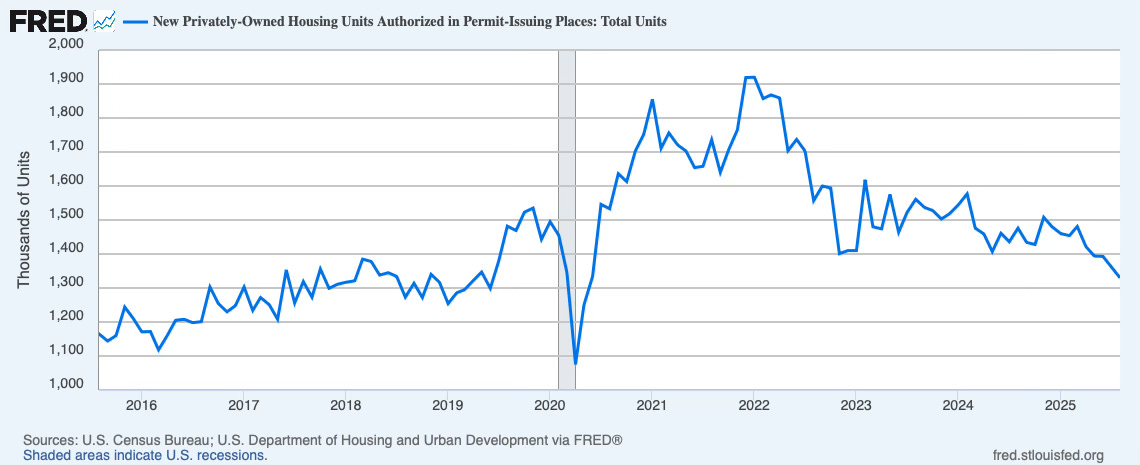
So it’s no surprise that single-family permits are down meaningfully from their 2021–22 peaks and have been choppy through 2025. They’re not collapsing, but they’re clearly decelerating. Exactly what you’d expect from an industry shifting from “expansion and scarcity pricing” to “cash-flow defense and asset-light.”
But the picture gets cloudier when you look at actual closings.
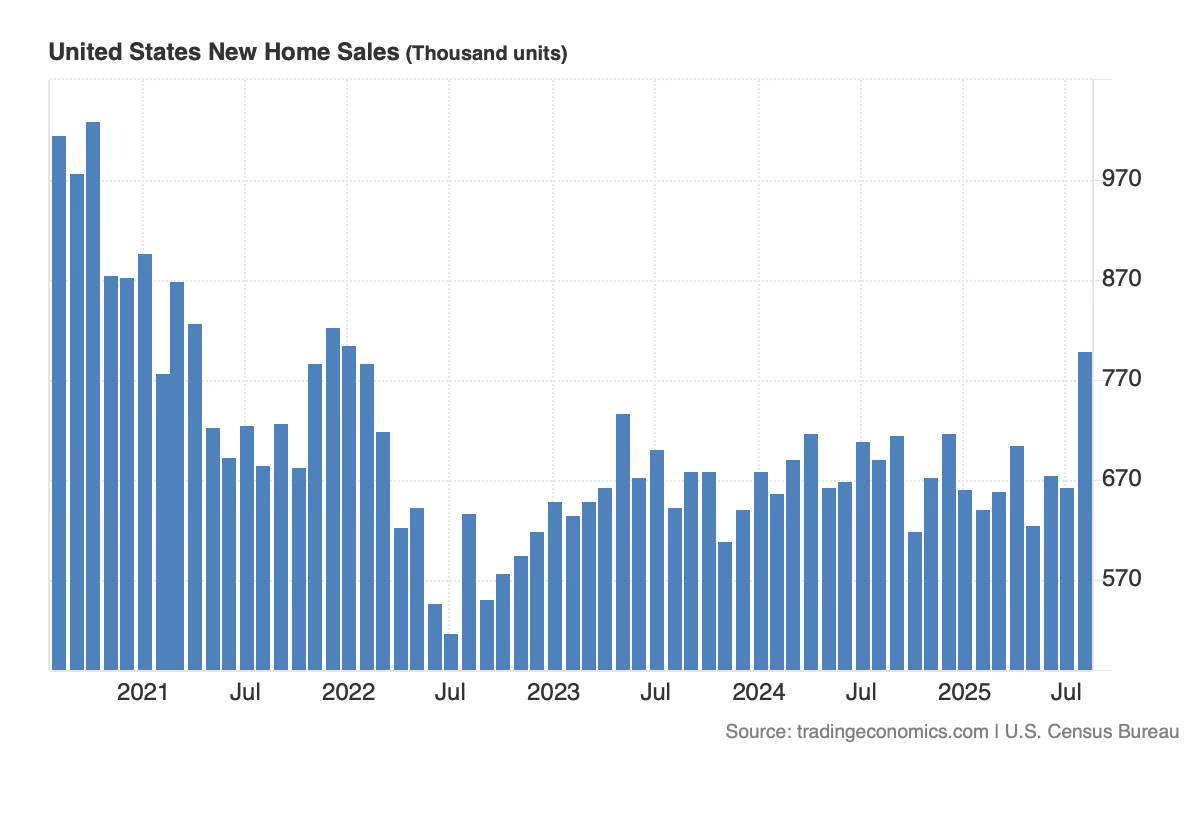
In August 2025, new single-family home sales jumped to an 800,000 SAAR. Up 20.5% month-over-month and 15.4% year-over-year, the strongest print in more than two years. That’s a real move, but it’s hard to read as a clean demand resurgence when builders are leaning so heavily on buy downs and incentives to manufacture affordability.
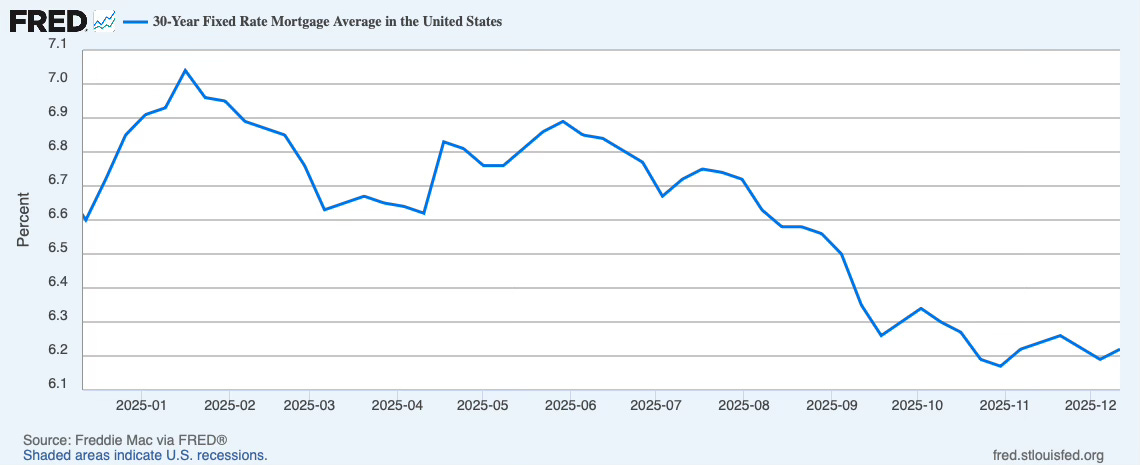
It also lines up with a key theme for this entire market. Rates still drive behavior, even for higher-end and equity-rich buyers. Mortgage rates eased during that window. Freddie Mac’s survey had the 30-year fixed at 6.63% in early August (down from the prior week). When financing costs fall even a little, it pulls marginal buyers off the fence, especially in move-up tiers where a “small” rate shift moves the payment by hundreds of dollars.
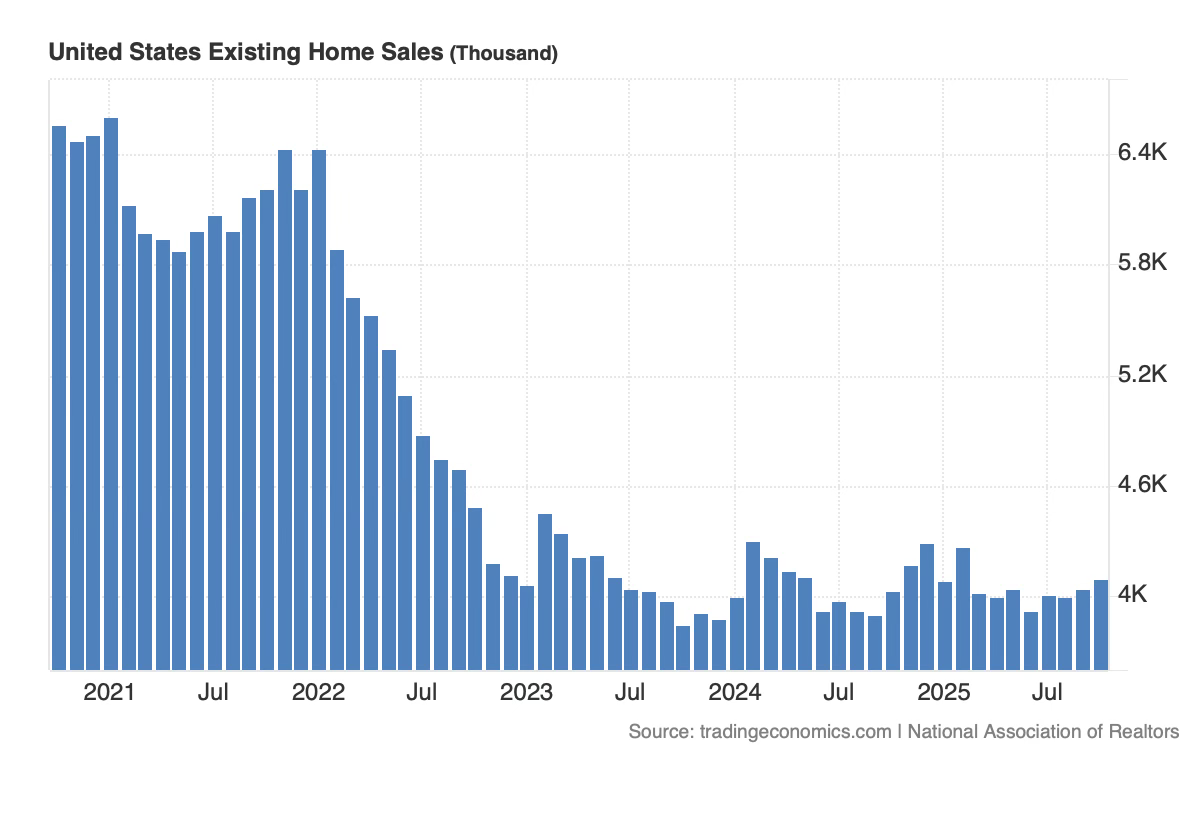
Existing-home sales tell a similar story. Lots of noise around the edges, but no durable break in the low-volume regime. NAR reported October existing-home sales at a 4.1 million SAAR, up 1.2% month-over-month and 1.7% year-over-year. That’s an improvement. But it’s still a depressed transaction environment by 2010s standards.
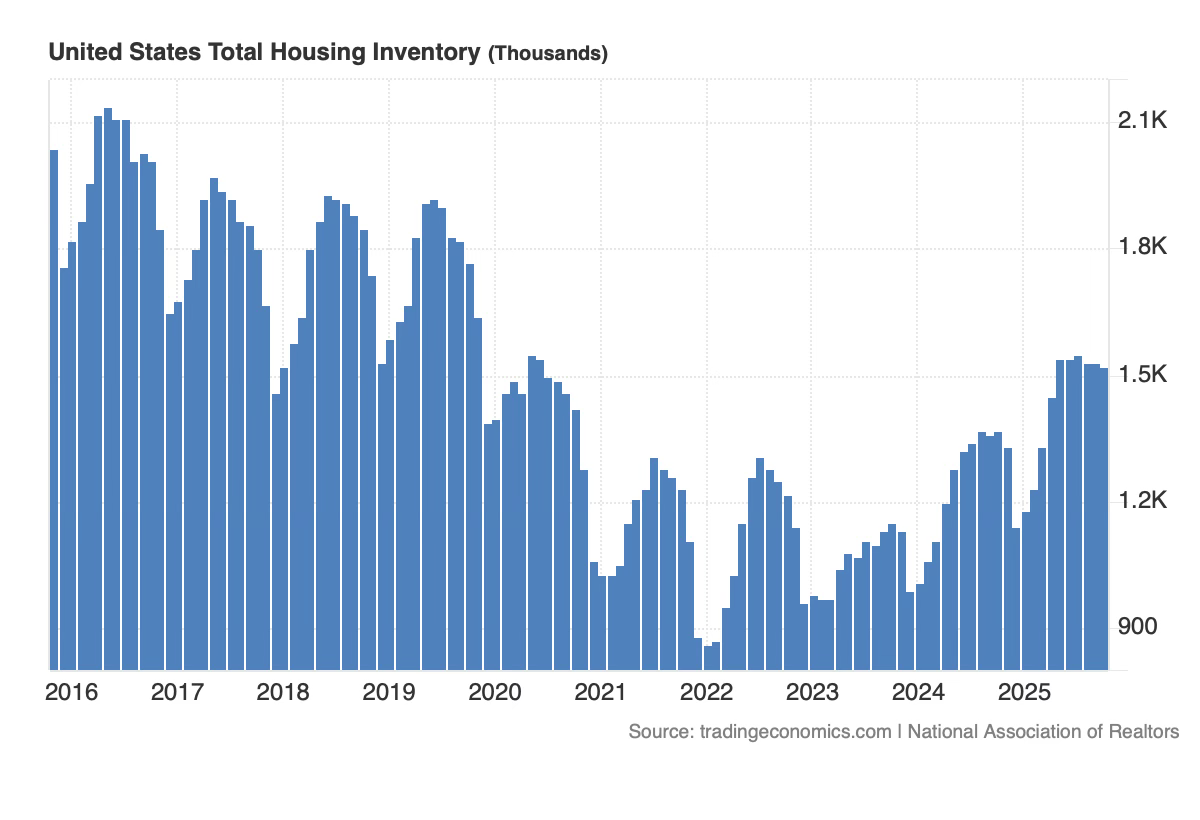
Inventory, however, is rebuilding. NAR has existing-home inventory at 1.52 million units and 4.4 months of supply. That’s a meaningful loosening from the pandemic lows, but still short of the classic 5–6 month “balanced” range.
And as Lance Lambert has highlighted, a growing number of states have now surpassed pre-pandemic inventory levels, masking a sharp geographic divide. The West and much of the Sunbelt are dealing with elevated inventory and softer pricing. The Northeast is still running a meaningful deficit.
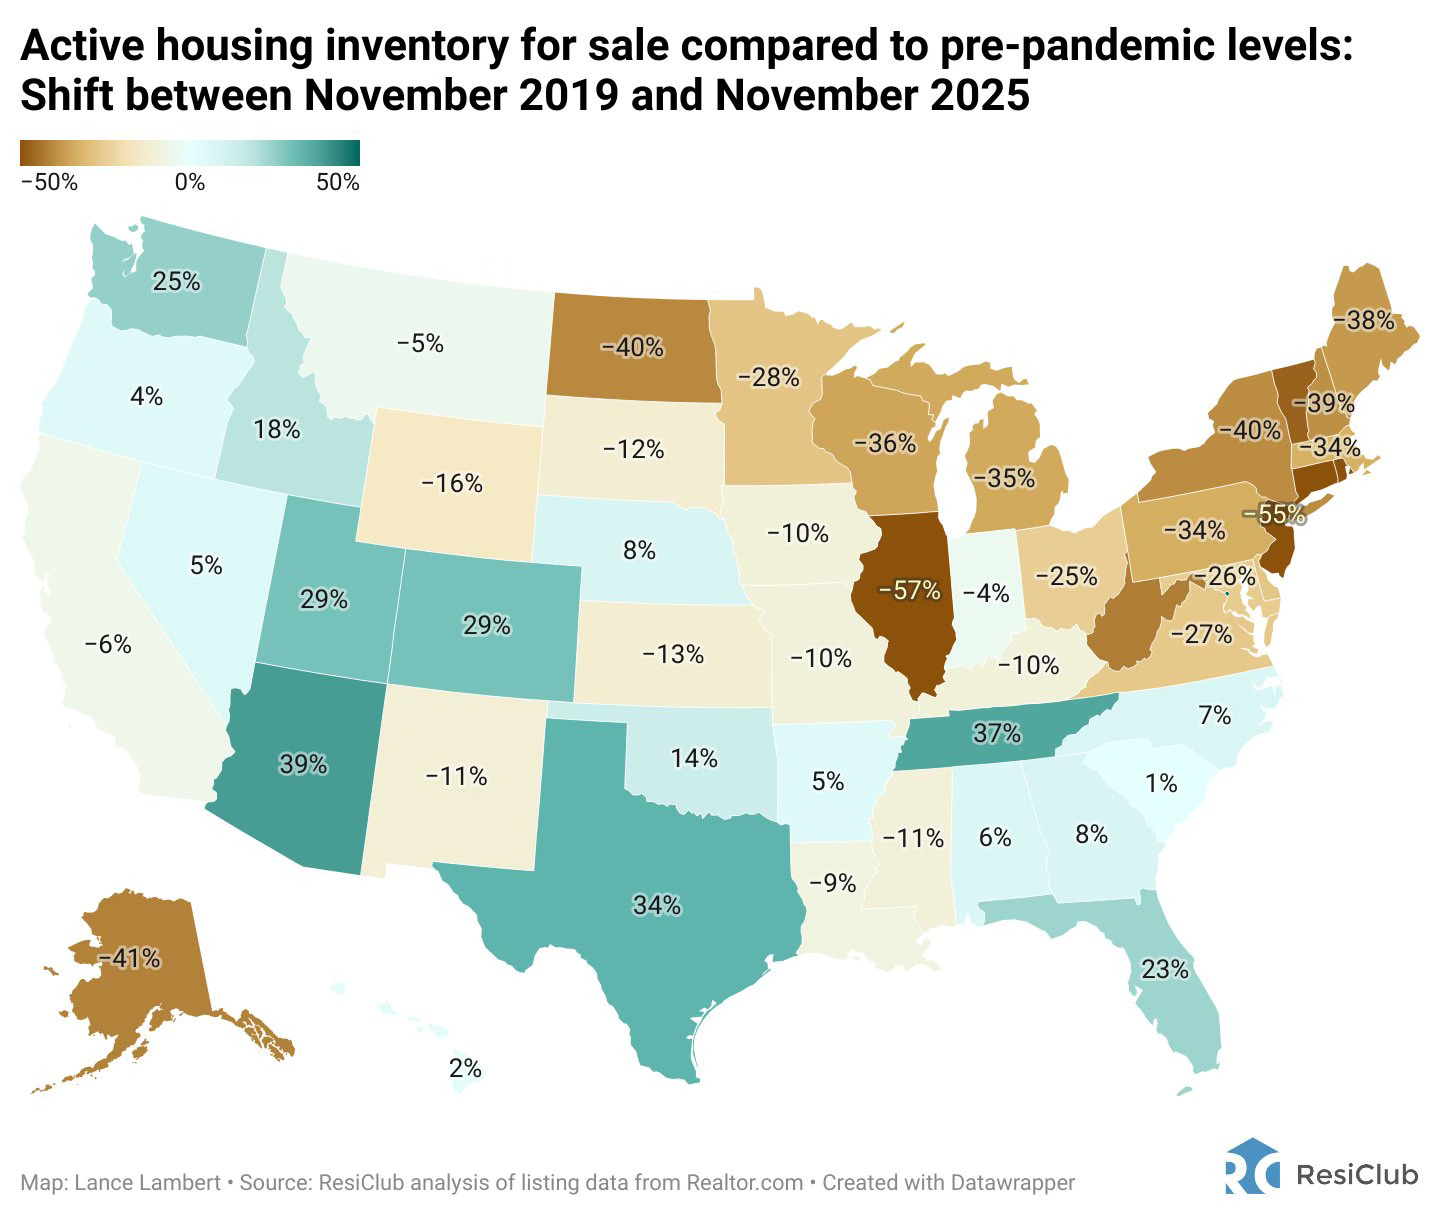
Source: X.com,ResiClub
So what does that mean for prices?
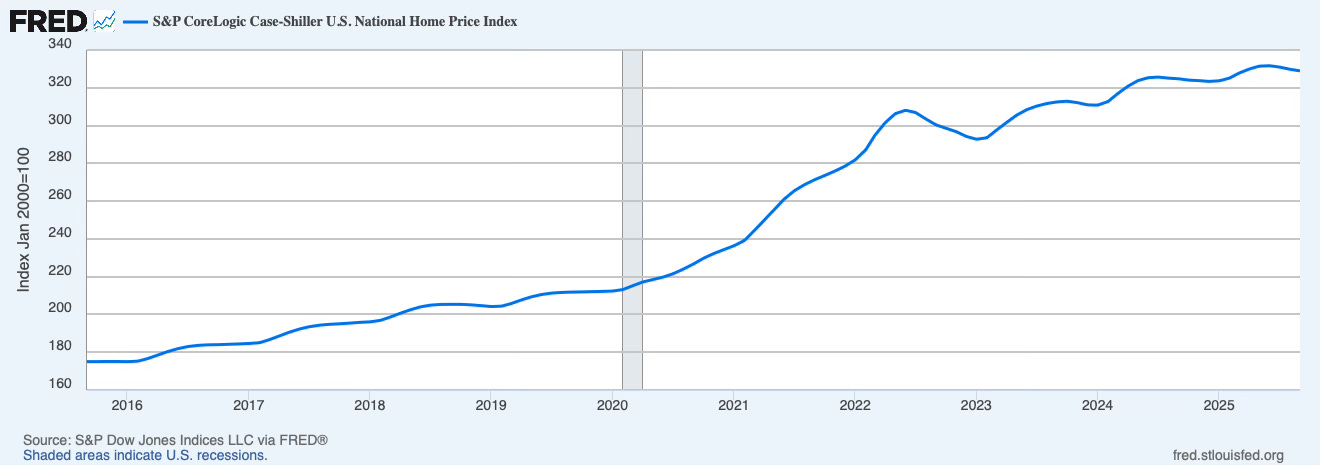
On the surface, the national price data look benign. Case-Shiller is up about 1.3% year-over-year through September 2025.
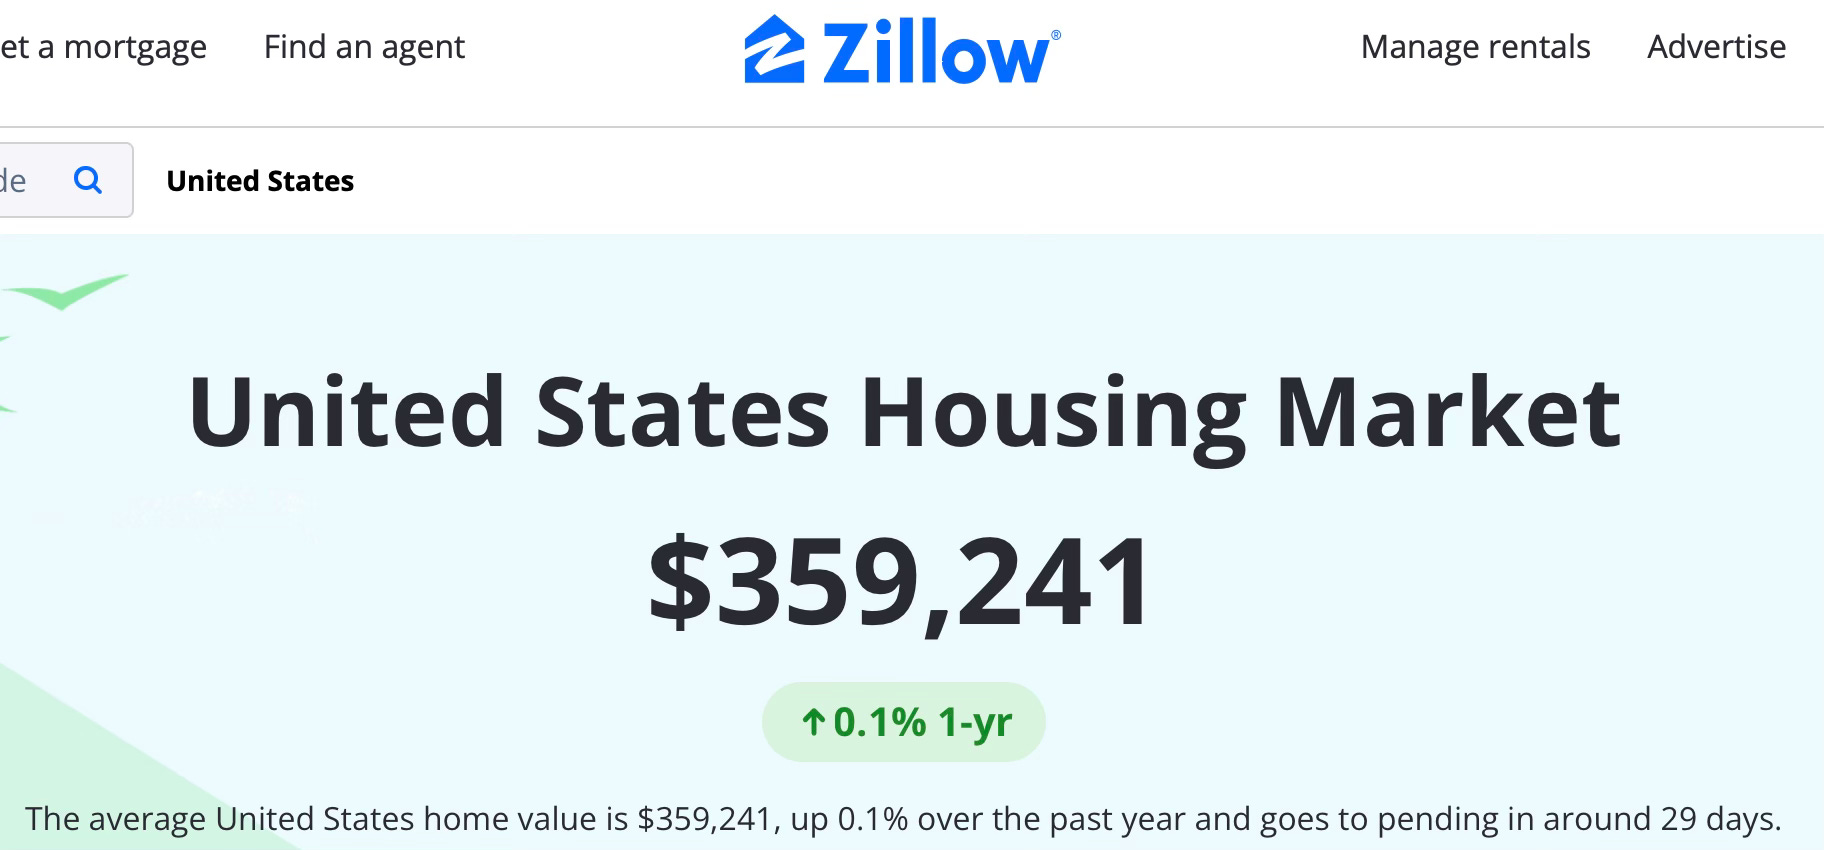
Zillow’s national index is basically flat, up a tenth of a percent.
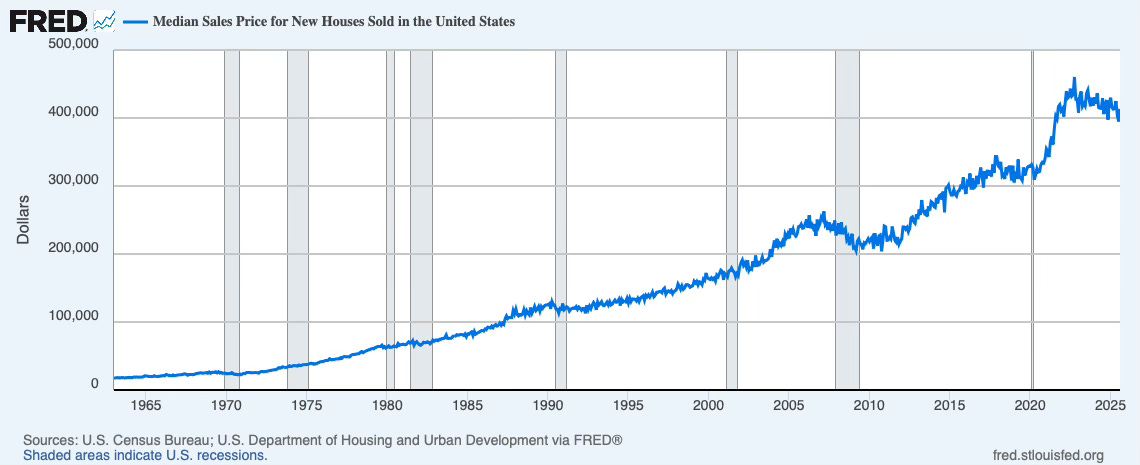
But new-construction is telling you something different. Census/HUD data show new-home prices clearly peaked in 2022 and have been slowly backsliding since. While builders defend contract prices with double-digit incentives and mortgage-rate buy downs that don’t show up in the headline median numbers.
Then Zillow dropped a different kind of bomb.
Zillow’s October analysis finds 53% of homes have a Zestimate lower than a year ago, up from 16% a year earlier and the highest share since 2012. That breadth metric is fundamentally different from median price indices. It’s asking, “How many individual homes are down?” not “what is the typical home worth?”
How do we reconcile all these apparently conflicting data points? Are prices going up or down?
The answer is that we’re measuring different things and averaging them in ways that hide what’s happening to the typical property.
Zillow’s breadth statistic is comparing each home’s estimated value to where it stood one year earlier and counting how many are down. Many of those moves are small, plus or minus 1–2%. If slightly more than half of homes are down a little and slightly fewer than half are up a bit more, national averages can still grind higher while most individual homes tick lower.
Meanwhile, the Census series is capturing a different universe altogether. New construction. Where builders can re-mix toward smaller product, shift geography and use incentives to hold sticker price while cutting the effective price and payment.
Once you look at the map the pattern gets even clearer. The broadest and deepest corrections are in the Sunbelt (and to a lesser extent the West), the pandemic darlings that went vertical in 2020–22. Austin, Phoenix, Boise and much of Florida. Prices are off the highs and concessions are back. A lot of the “53% of homes are down” story is really “the boomtowns are digesting their hangover.”
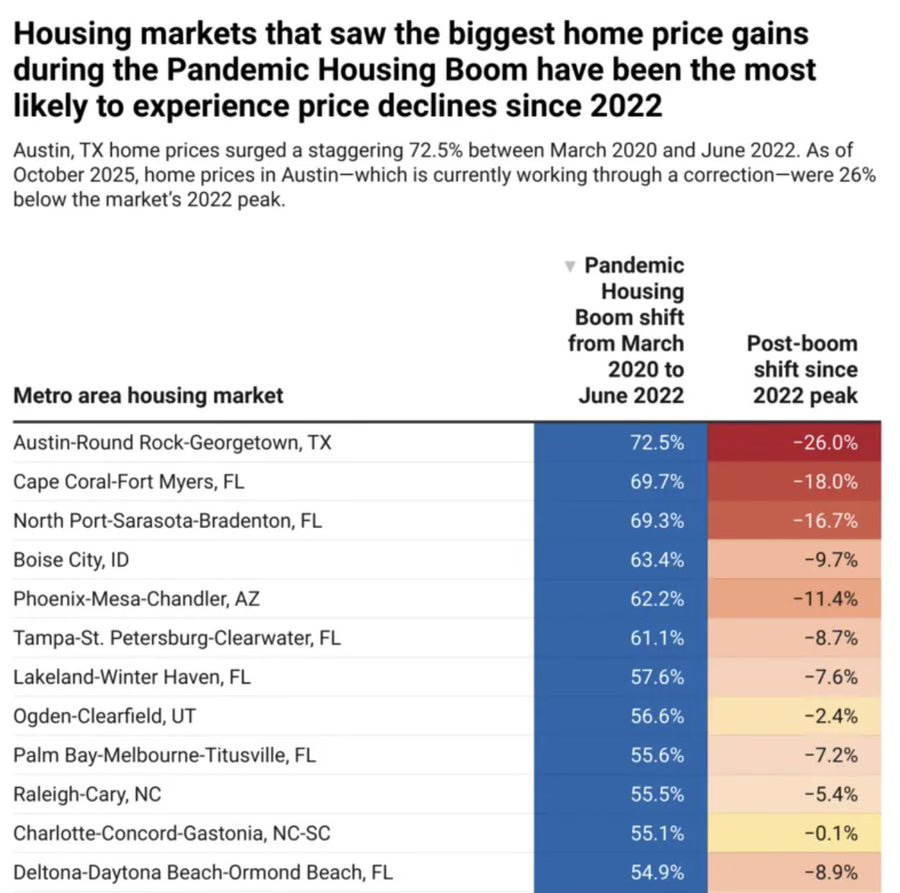
Source: X.com, ResiClub
At the same time, a very different story is playing out in affordable Midwest and Northeast “refuge markets.” These places never went parabolic, they still pencil against local incomes, and they’re picking up demand from buyers who have tapped out on coastal pricing. Zillow’s own October data shows some of the strongest year-over-year gains in places like Cleveland (~4.5%), Hartford (~4.4%), and Milwaukee (~4.0%).
There’s also a price-tier layer, but it’s more nuanced than the usual “luxury strong, entry-level weak” cliché. Lower and middle tiers are where buyers are most rate-sensitive and where the lock-in effect is strongest on the seller side. Entry-level owners are the most locked-in, sitting on 3% mortgages while any trade-up means 6–7% financing. The math simply doesn’t work, so they don’t list.
That combination produces a strange equilibrium. Very tight inventory in low and middle tiers because potential sellers are stuck and very weak sales in those same tiers because potential buyers are boxed out. Both the stock and the flow shrink. You can have low months-of-supply and still have transactions running far below a normal year. That mix effect props up the median price (because fewer cheap homes trade) even as a large share of individual entry-level properties quietly give back a bit of their pandemic gains.
The sharper dividing lines in this cycle really run by region and by where each market sits in the post-COVID arc, not simply by price tier. Pandemic boomtowns in the West and Sunbelt are cooling or correcting. Steady-eddy refuge markets in the Midwest and Northeast are still inching up. And within each, the lower tiers are jammed by affordability and lock-in, while the upper tiers largely trade on income and equity.
Put it all together and the for-sale housing market looks something like this:
Still a low-transaction environment. Existing-home sales have bounced off the absolute lows but remain well below 2010s norms; new-home sales have had a couple of strong prints (August’s 800k SAAR stands out), but we are not in a new boom.
Inventory rebuilding, but unevenly. Existing inventory is ~1.52M (4.4 months) as of October 2025 but 18 states are already above pre-pandemic inventory levels, masking a big regional split.
Builders behaving late-cycle. Land-light pipelines, real impairment/abandonment charges and margin compression as incentives do the heavy lifting against a backdrop of rebuilt new-home inventory (including completed homes back near post-GFC highs).
Rate-driven volume. The August sales pop coincided with easing mortgage rates, underscoring that even affluent, equity-rich buyers remain payment-sensitive.
Prices are “flat on average, softer underneath.” Case-Shiller: +1.3% YoY (Sep 2025); Zillow national: ~+0.1% YoY; but 53% of homes are down YoY at the property level.
The sharpest adjustment is where the boom was loudest. Western and Sunbelt markets that led the 2020–22 surge have moved the most; many Midwestern and Northeastern markets are still slowly grinding higher.
For-sale housing has shifted into a broad, slow-motion real price correction, more grind than crash, with the sharpest give-back in the same markets that led on the way up.
The natural next question is whether households are in good enough shape to absorb that adjustment and who still gets to participate in ownership at all. That takes us directly into the consumer/household side of the story.
Next in the series: We Take a Closer Look At The Consumer, Households and How They Are Holding Up…
“♡ Like” — if you’ve felt the correction… even when the averages say “flat.”
Sources and Further Reading
Market Data and Public Indicators
NAR Existing-Home Sales (Oct 2025): https://www.nar.realtor/newsroom/existing-home-sales-slid-1-6-in-october
Census New Residential Sales (Aug 2025): https://www.census.gov/construction/nrs/pdf/newressales.pdf (or the “New Residential Sales” release page)
Freddie Mac PMMS (Aug 14, 2025 – includes the prior week’s 6.63%): https://www.globenewswire.com/news-release/2025/08/14/3133713/0/en/Mortgage-Rates-Continue-to-Decline.html
Zillow Oct 2025 market report: https://www.zillow.com/research/october-2025-market-report-35733/
Zillow “53% of homes lost value” research: https://www.zillow.com/research/home-value-decline-35724/
NAHB “226 metros down from peaks” note: https://www.nahb.org/blog/2025/12/third-quarter-house-price-appreciation
PNC Case-Shiller (Sep 2025) summary PDF: https://www.pnc.com/content/dam/pnc-com/pdf/aboutpnc/EconomicReports/EconomicUpdates/2025/PNC_Economics_Research_Case-Shiller_25_November_2025.pdf
ResiClub / Lance Lambert inventory-by-state mention: https://www.resiclubanalytics.com/ (and link the specific post/tweet you used)
Public Homebuilders and Land Strategy
D.R. Horton FY2024 10-K landing: https://www.sec.gov/ixviewer/documents/ (search: D.R. Horton 2024 10-k)
D.R. Horton lot portfolio (Business Wire): https://www.businesswire.com/news/home/20241112556347/en/D.R.-Horton-Reports-Fiscal-2024-Fourth-Quarter-and-Full-Year-Results
PulteGroup FY2024 annual report PDF: https://www.sec.gov/Archives/edgar/data/822416/000082241625000013/phm-20241231.htm
Lennar Q2 2025 earnings (incentives line): https://investors.lennar.com/ (earnings release / supplemental)